There will be short moment around the level 🦊Now the b.bank reached it top around level so there is highly possible to have a short moment.
Safe trade
rawsenahdidnaram13
BANDHANBNK trade ideas

Today it given a very good moment 😊Good move to upside and not it down level it proves upside moment.
Safe trade
rawsenahdidnaram13

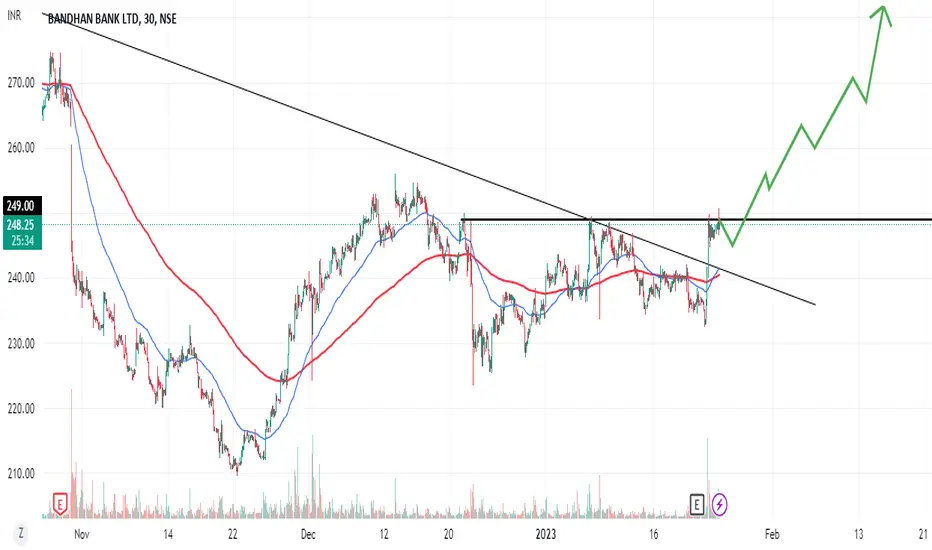
Today it was good move, let's see tomorrow morning 🌅Today it was fast up side moment but it reached it crucial level 🎚️ but there was a short side moment which provided more than 2% moment to it down side level . It was good that doesn't crossed it close which could trouble us 🤠 . At the last but not the least, it is good that the price move to the direction of 1st moved i.e to High level.
Thank you......
Your faithfully,
rawsenahdidnaram13

Good for today small shortToday , it is good to short not to be too long short but a small short only for today.

Bandhan bank made a good price action Bandhan bank share made a significant price action by re-testing important support of two years, which is now a resistance. But now is not a good time for shorting (future) as it has now fallen 15% already in just three sessions. Wait for a pause - a small and volatile green candle. When the low of that candle breaks, that's the time to short for a target of 155 (low of 3 years).
Prediction : First, a pause at this level, then more selling pressure tile 10-12% more drop from here.
Action plan: The risk is high as the candles are big. Trade intraday if your shorting setup is formed. Buy in intraday with half position size and very small targets. Shorting the future is only recommended for an aggressive trader with a small stop-loss.

BANDHAN BANKHelloo and welcome to this analysis
In the weekly chart we can see an ABC from ATH to ATL
This was followed by a diagonal which for now I have plotted as a Leading Impulse. A bearish diagonal would mean that the preceding ABC was a W and the diagonal was X.
The decline after completion of the diagonal is also in the form of an ABC which could complete its path near 150.
Bullish Count would then hold as LD (Wave 1/A) followed by an ABC corrective (Wave 2/B).
However, if the stock makes an ATL then the bearish count will become active with current decline ABC structure being Wave Y.
In either alternatives keep an eye between ATL & 150 for a possible reversal/bounce as the case maybe.

Bandhan Bank : Break the Trendline5 Step Analysis of Bandhan Bank
1. On Daily TF Stock has break the trendline which was reacted as support line and sustained from July 2022
2. Stock Momentum very weak on Daily weekly & Monthly timeframe
3. Stock break the 20DMA from last week and still stock traded below 20MA
4. Stock today traded at lower low
5. If Price break the185 level and give closing at this level then further downside we can see at 182 to 180 levels.

BANDHAN BANKTHE IDEA WILL BE ONLY FOR STUDY PURPOSE .
wait for the breakout till then keep your eye on the stock .


PREDICTIONS OF PRICE MOVEMENT BANDHAN BANKtf 1 h bearish move today in intraday
ellio wave leg1 and 2 is completed
and look for completion of 3 and 5
look for sell opportunity in trading today

BANDHAN BANK CHARTTHE IDEA WILL BE ONLY FOR STUDY PURPOSE .
wait for the breakout till then keep your eye on the stock .

BANDHAN BANK SWING TRADE SETUPThis right here is a symmetrical triangle which i believe could break to the upside. But regardless we shall see what happens cause the price even break towards the bottom which could result in massive fall due to the presence of a major yearly trendline, but at the end of the day this setup is just out here for the record ( and for fun;) ).
Happy Trading !!!

BUY BANDHAN BANK TARGET 290Buy bandhan bank for target of 290 keep stop loss at 225 and hold for out targetss this is totally based on result strategy..we can see breakout soon in bandhan bank and that trend will take bandhan bank towards 300+
Please like and follow me on tradingview
Thankyou:-))
BANDHAN BANKBandhan bank is making triangle pattern on daily timeframe chart, I am when price sustain above 255 level now it is trading at trendline resistance so keep eyes on it if it reject from here then we can get shorting opportunity.


BANDHAN BANKtriangle pattern is formed on daily time frame breakout in anyside can give a movementum so wait for the breakout then can enter with a small stoploss. and also budget date is near so market is very volatile and this time price action also not worked properly.

Bandhan BankDay chart of bandhan bank in which it is making triangle pattern if it gives breakout in anyside I will enter with a very small stop loss

Will Bandhan Bank descend to channel?Bandhan bank has been following a downward channel for last one year. Will it be able to break the trend to move out of the channel or will it keep following the downward move ? My bet is on downward .. what's yours?

BUY BANDHAN BANKGreat momentum with RSI indicating strong movement upside. The target for 261 and 271 with a stop loss of 240.8 in a very short term.
For educational purposes.

bandhanbankEMA is running like a dog, momentum is strong, usually when ema is strong like a dog it is god to short at whatever price you get


Bandhan BankHello and welcome to this analysis
Upon completing a Bearish 5-0 Harmonic pattern it has formed a Bullish Harmonic AB=CD (62/162) at 225 and at the same time activated another Bullish Harmonic AB=CD (38/224) 225-215 PRZ.
Bullish reversal is being seen today. As long as its above 215 it can do 250/275. Accumulate in the zone of 225-235
Good risk reward set up at current level
Happy Investing

