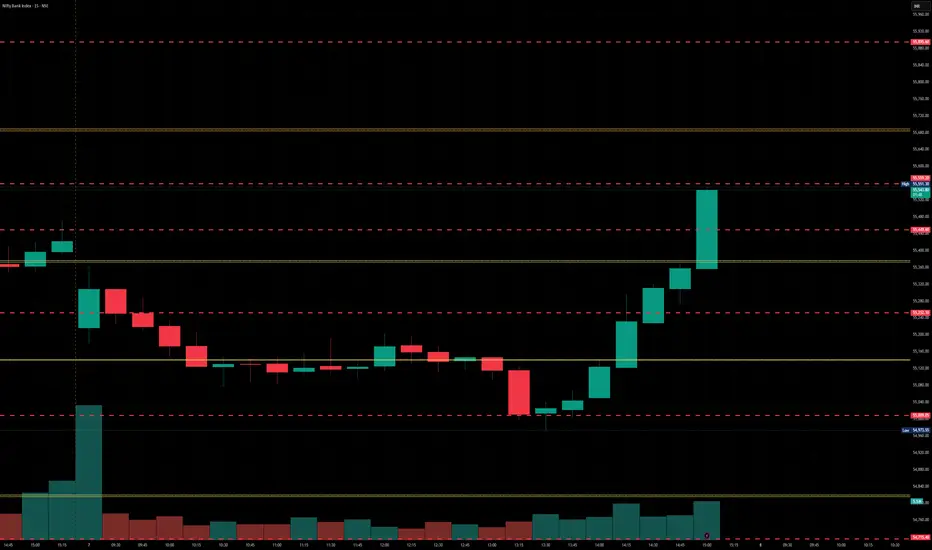
BankNifty levels - Aug 07, 2025Utilizing the support and resistance levels of BankNifty, along with the 5-minute timeframe candlesticks and VWAP, can enhance the precision of trade entries and exits on or near these levels. It is crucial to recognize that these levels are not static, and they undergo alterations as market dynamics evolve.
The dashed lines on the chart indicate the reaction levels, serving as additional points of significance. Furthermore, take note of the response at the levels of the High, Low, and Close values from the day prior.
We trust that this information proves valuable to you.
* If you found the idea appealing, kindly tap the Boost icon located below the chart. We encourage you to share your thoughts and comments regarding it.
Wishing you successful trading endeavors!
BANKNIFTY trade ideas

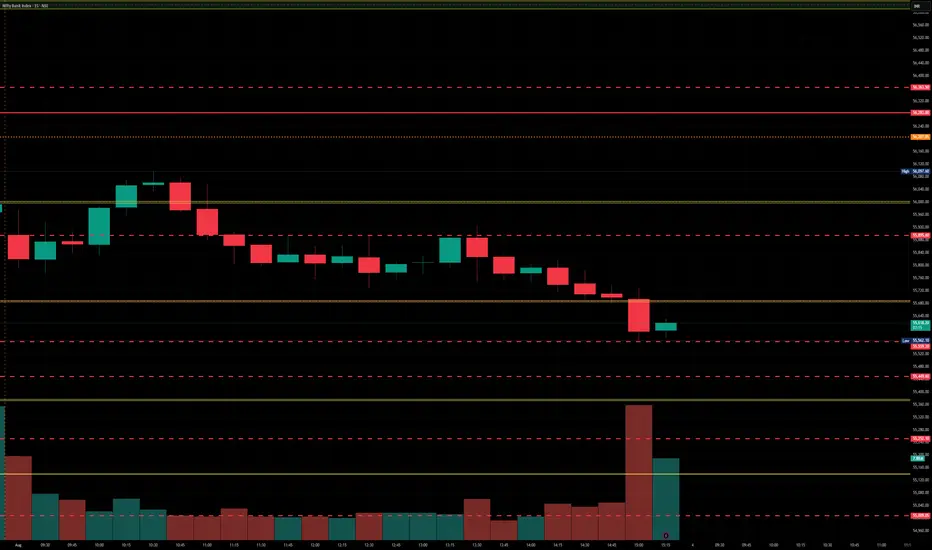
BankNifty levels - Aug 05, 2025Utilizing the support and resistance levels of BankNifty, along with the 5-minute timeframe candlesticks and VWAP, can enhance the precision of trade entries and exits on or near these levels. It is crucial to recognize that these levels are not static, and they undergo alterations as market dynamics evolve.
The dashed lines on the chart indicate the reaction levels, serving as additional points of significance. Furthermore, take note of the response at the levels of the High, Low, and Close values from the day prior.
We trust that this information proves valuable to you.
* If you found the idea appealing, kindly tap the Boost icon located below the chart. We encourage you to share your thoughts and comments regarding it.
Wishing you successful trading endeavors!
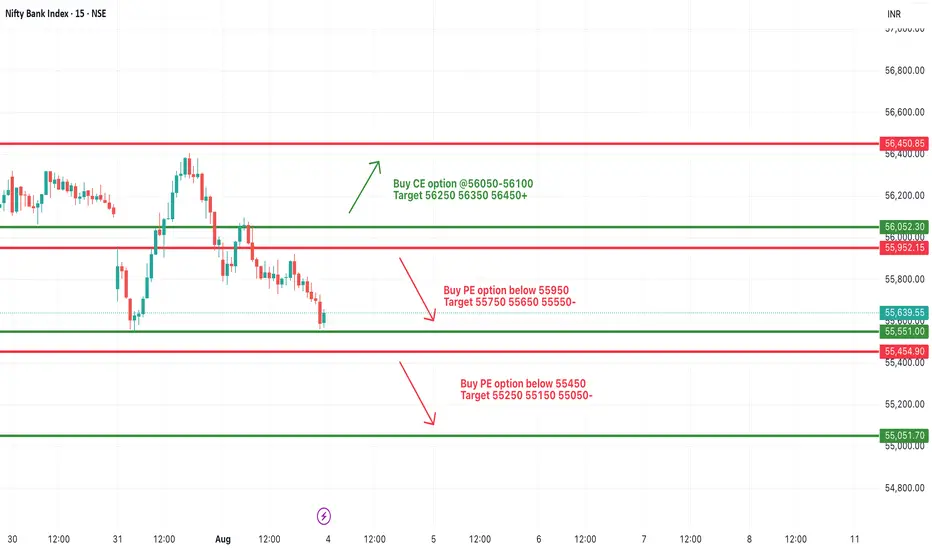
[INTRADAY] #BANKNIFTY PE & CE Levels(04/08/2025)Bank Nifty is expected to open flat or slightly gap up near the 55,600–55,650 zone. This zone could act as a critical decision point for today’s session, and price action around it will likely determine the trend for the day.
If Bank Nifty sustains above 55,950, a bullish reversal move may be triggered with potential upside targets at 56,250, 56,350, and 56,450+. A breakout above 56,050–56,100 will be essential to confirm bullish momentum.
On the downside, if Bank Nifty fails to hold above 55,950 and breaks below the 55,950–55,900 zone, a bearish continuation could unfold. Breakdown below 55,950 opens downside targets of 55,750, 55,650, and 55,550. A deeper fall can be expected if 55,450 is broken, with targets at 55,250, 55,150, and 55,050-.
Intraday traders should closely monitor price behavior around the 55,950–56,050 resistance zone.
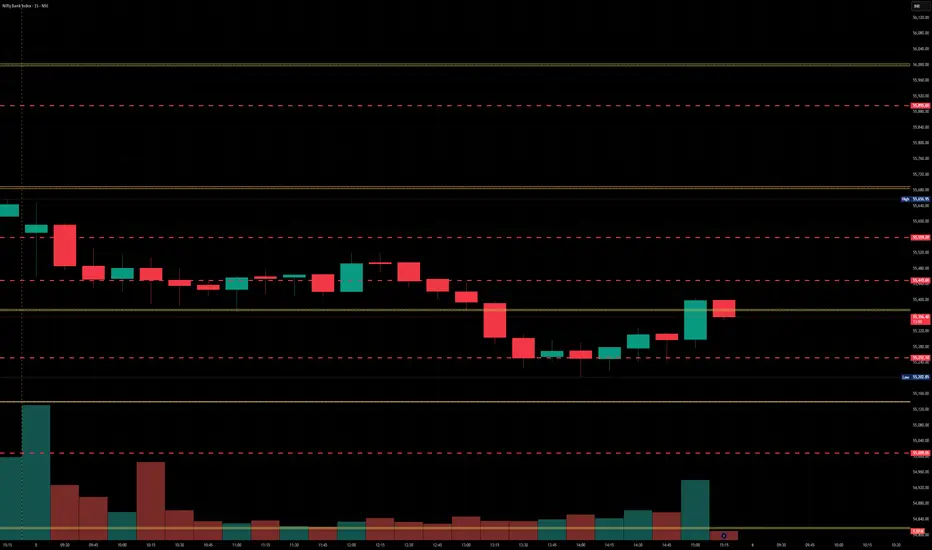
BankNifty levels - Aug 06, 2025Utilizing the support and resistance levels of BankNifty, along with the 5-minute timeframe candlesticks and VWAP, can enhance the precision of trade entries and exits on or near these levels. It is crucial to recognize that these levels are not static, and they undergo alterations as market dynamics evolve.
The dashed lines on the chart indicate the reaction levels, serving as additional points of significance. Furthermore, take note of the response at the levels of the High, Low, and Close values from the day prior.
We trust that this information proves valuable to you.
* If you found the idea appealing, kindly tap the Boost icon located below the chart. We encourage you to share your thoughts and comments regarding it.
Wishing you successful trading endeavors!
BankNifty levels - Jul 04, 2025Utilizing the support and resistance levels of BankNifty, along with the 5-minute timeframe candlesticks and VWAP, can enhance the precision of trade entries and exits on or near these levels. It is crucial to recognize that these levels are not static, and they undergo alterations as market dynamics evolve.
The dashed lines on the chart indicate the reaction levels, serving as additional points of significance. Furthermore, take note of the response at the levels of the High, Low, and Close values from the day prior.
We trust that this information proves valuable to you.
* If you found the idea appealing, kindly tap the Boost icon located below the chart. We encourage you to share your thoughts and comments regarding it.
Wishing you successful trading endeavors!
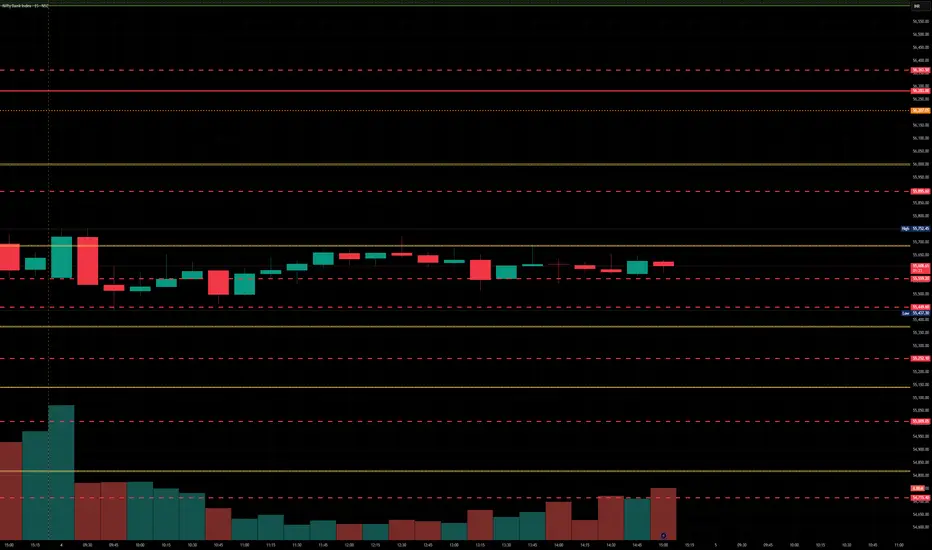
BanknIfty levels - Aug 08, 2025Utilizing the support and resistance levels of BankNifty, along with the 5-minute timeframe candlesticks and VWAP, can enhance the precision of trade entries and exits on or near these levels. It is crucial to recognize that these levels are not static, and they undergo alterations as market dynamics evolve.
The dashed lines on the chart indicate the reaction levels, serving as additional points of significance. Furthermore, take note of the response at the levels of the High, Low, and Close values from the day prior.
We trust that this information proves valuable to you.
* If you found the idea appealing, kindly tap the Boost icon located below the chart. We encourage you to share your thoughts and comments regarding it.
[INTRADAY] #BANKNIFTY PE & CE Levels(29/07/2025)Bank Nifty is expected to open with a gap-down, continuing its downside pressure from the previous sessions. The index is now hovering near an important support zone around 56,050–55,950.
If Bank Nifty sustains above the 56,050–56,100 zone after the gap-down open, a reversal rally can be seen with potential upside targets of 56,250, 56,350, and 56,450+. This zone may offer a low-risk long opportunity, provided price action confirms strength.
However, if Bank Nifty remains below 56,050 and especially breaches 55,950, fresh short positions can be initiated with downside targets of 55,750, 55,650, and 55,550-. A close below this support zone can accelerate the selling momentum further.
The market remains in a bearish tone unless a clear reversal structure forms above 56,050.

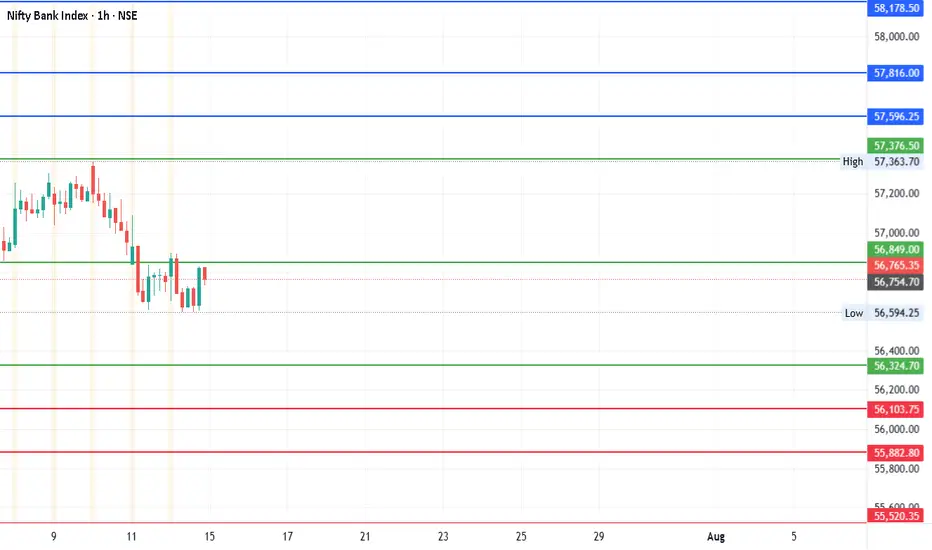
#BankNifty Weekly: Major Levels & Targets You Need to KnowDate: 14-07-2025
#Nifty Bank Technical Levels
Current Price: ₹56,765.35
Pivot Point: ₹56,849.40
Upside Targets (if price moves above Pivot)
| Target | Price |
| ----------- | ---------- |
| 🎯 Target 1 | ₹57,596.25 |
| 🎯 Target 2 | ₹57,816.00 |
| 🎯 Target 3 | ₹58,178.48 |
| 🎯 Target 4 | ₹58,540.95 |
🔽 Downside Targets (if price drops below Pivot)
| Target | Price |
| ----------- | ---------- |
| 🎯 Target 1 | ₹56,103.76 |
| 🎯 Target 2 | ₹55,882.80 |
| 🎯 Target 3 | ₹55,520.33 |
| 🎯 Target 4 | ₹55,157.85 |
🛑 Support & Resistance Levels
Support: ₹56,324.71
Resistance: ₹57,376.51
Observations:
Since the current price is below the pivot (₹56,849.40), immediate bearish bias could be assumed unless a strong reversal happens.
A break below ₹56,324.71 (Support) could trigger the downside targets.
Conversely, crossing back above the pivot may shift bias to bullish, targeting the resistance and beyond.
#TradingView #Stocks #Equities #StockMarket #Investing #Trading #Nifty
#TechnicalAnalysis #StockCharts #Finance #BankNifty #NiftyBank #WeeklyAnalysis
#Banknifty directions and levels for July 31st:
What can we expect today?
In the previous session, both Nifty and Bank Nifty went through consolidation.
Structurally, we are still in a bearish tone, and with Gift Nifty indicating a gap-down start,
if the market breaks the immediate support levels with a solid candle, we can expect further correction.
On the other hand, if it finds support there, then the range-bound movement is likely to continue.
Which means, if the initial market takes a pullback, we can expect consolidation within the previous day’s range.

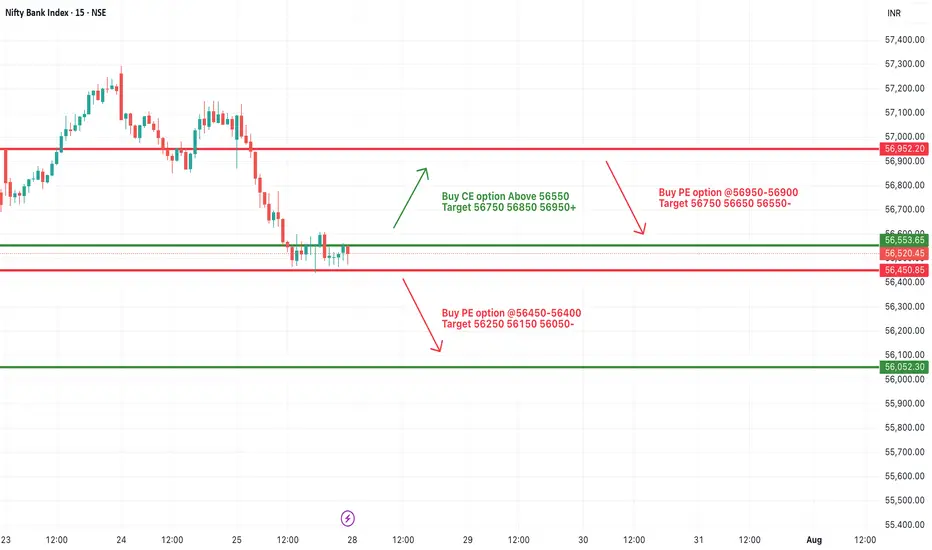
[INTRADAY] #BANKNIFTY PE & CE Levels(28/07/2025)Bank Nifty is expected to open slightly lower and is currently trading near a critical zone of 56,450–56,550, which may act as a key pivot for today's session. This narrow band will decide the next directional move.
If Bank Nifty sustains above 56,550, we can expect an upward move toward 56,750, 56,850, and 56,950+ levels. This zone could act as a breakout trigger for intraday momentum on the upside.
On the downside, if the index slips and trades below 56,450–56,400, it may indicate bearish pressure, with possible downside targets at 56,250, 56,150, and 56,050-.
Alternatively, a rejection near the 56,900–56,950 zone could also act as a reversal point and push the index back down.
For now, wait for a clear breakout or breakdown from the 56,450–56,550 range before taking directional trades.
BankNifty levels - Aug 01, 2025Utilizing the support and resistance levels of BankNifty, along with the 5-minute timeframe candlesticks and VWAP, can enhance the precision of trade entries and exits on or near these levels. It is crucial to recognize that these levels are not static, and they undergo alterations as market dynamics evolve.
The dashed lines on the chart indicate the reaction levels, serving as additional points of significance. Furthermore, take note of the response at the levels of the High, Low, and Close values from the day prior.
We trust that this information proves valuable to you.
* If you found the idea appealing, kindly tap the Boost icon located below the chart. We encourage you to share your thoughts and comments regarding it.
Wishing you successful trading endeavors!

BankNifty levels - Jul 29, 2025Utilizing the support and resistance levels of BankNifty, along with the 5-minute timeframe candlesticks and VWAP, can enhance the precision of trade entries and exits on or near these levels. It is crucial to recognize that these levels are not static, and they undergo alterations as market dynamics evolve.
The dashed lines on the chart indicate the reaction levels, serving as additional points of significance. Furthermore, take note of the response at the levels of the High, Low, and Close values from the day prior.
We trust that this information proves valuable to you.
* If you found the idea appealing, kindly tap the Boost icon located below the chart. We encourage you to share your thoughts and comments regarding it.
Wishing you successful trading endeavors!

BankNifty levels - Jul 30, 2025Utilizing the support and resistance levels of BankNifty, along with the 5-minute timeframe candlesticks and VWAP, can enhance the precision of trade entries and exits on or near these levels. It is crucial to recognize that these levels are not static, and they undergo alterations as market dynamics evolve.
The dashed lines on the chart indicate the reaction levels, serving as additional points of significance. Furthermore, take note of the response at the levels of the High, Low, and Close values from the day prior.
We trust that this information proves valuable to you.
* If you found the idea appealing, kindly tap the Boost icon located below the chart. We encourage you to share your thoughts and comments regarding it.
Wishing you successful trading endeavors!

BankNfity levels - Jul 31, 2025Utilizing the support and resistance levels of BankNifty, along with the 5-minute timeframe candlesticks and VWAP, can enhance the precision of trade entries and exits on or near these levels. It is crucial to recognize that these levels are not static, and they undergo alterations as market dynamics evolve.
The dashed lines on the chart indicate the reaction levels, serving as additional points of significance. Furthermore, take note of the response at the levels of the High, Low, and Close values from the day prior.
We trust that this information proves valuable to you.
* If you found the idea appealing, kindly tap the Boost icon located below the chart. We encourage you to share your thoughts and comments regarding it.
Wishing you successful trading endeavors!

BANK NIFTY📈 Trade Setup Details
🔹 Trade Plan 1 (MTF-Based Entry)
Metric Value
Entry 56,223
Stop Loss 55,475
Risk 748 pts
Target 63,232
Reward 7,009 pts
Risk:Reward 1:9.4
🔸 Comment:
A high RR setup using the Daily DMIP zone. Ideal for trend continuation if price respects 55,780–56,223 range.
🔹 Trade Plan 2 (Deep Pullback Entry - ITF Zone)
Metric Value
Entry 54,054
Stop Loss 53,483
Risk 571 pts
Target 61,819
Reward 7,765 pts
Risk:Reward 1:13.6
🔸 Comment:
An aggressive RR trade if price retraces. Very favorable for swing traders anticipating bounce from deeper ITF demand zone.
🧭 Technical Landmarks
Key Level Value
Last High 55,467
Last Low 47,702
Point Range 7,765
🧠 Strategic Notes
Bias: Strong Bullish.
Preferred Entry: If price reacts bullishly at 56,223, can trigger first trade. If market dips, watch 54,054 for second trade.
Stop Loss Discipline: Clearly placed with low drawdown.
Trend Confirmation: All HTF zones are bullish, adding confidence to long entries.
🔍 Multi-Timeframe (MTF) Analysis Summary
Timeframe Trend Zone Type Proximal Distal Average
Yearly UP Rally-Base-Rally 54,467 44,429 49,448
Half-Yearly UP BUFL 54,467 49,654 52,061
Quarterly UP Rally-Base-Rally 54,467 49,156 51,812
HTF Avg. UP 54,467 47,746 51,107
| Monthly | UP | Rally-Base-Rally | 55,875 | 53,483 | 54,679 |
| Weekly | UP | Rally-Base-Rally | 56,328 | 55,381 | 55,855 |
| Daily | UP | DMIP (BUFL) | 56,223 | 55,780 | 56,002 |
| MTF Avg. | UP | | 56,142 | 54,881 | 55,512 |
| 240m | UP | DMIP | 55,942 | 55,475 | 55,709 |
| 180m | UP | DMIP | 55,597 | 55,475 | 55,536 |
| 60m | UP | DMIP | 55,597 | 55,475 | 55,536 |
| ITF Avg. | UP | | 55,712 | 55,475 | 55,594 |
✅ Conclusion: All timeframes are bullish, with higher highs and strong demand zones developing across MTF and ITF — indicating a clear uptrend continuation structure.
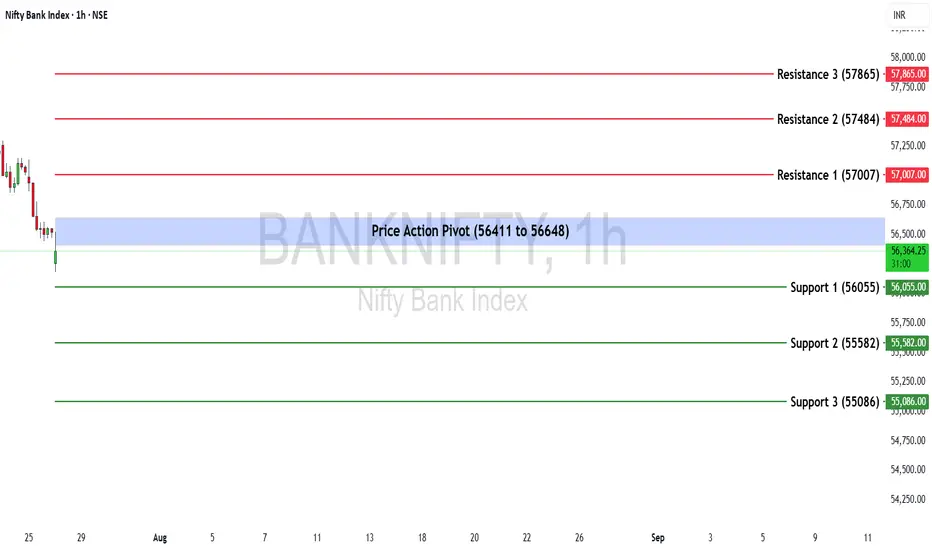
Bank Nifty Weekly Insights: Key Levels & TrendsBank Nifty ended the week at 56,528.90, registering a marginal gain of +0.44%.
🔹 Key Levels for the Upcoming Week
📌 Price Action Pivot Zone:
The critical zone to monitor for potential trend reversals or continuation lies between 56,411 and 56,648.
🔻 Support Levels:
Support 1 (S1): 56,055
Support 2 (S2): 55,582
Support 3 (S3): 55,086
🔺 Resistance Levels:
Resistance 1 (R1): 57,007
Resistance 2 (R2): 57,484
Resistance 3 (R3): 57,865
📈 Market Outlook
✅ Bullish Scenario:
If Bank Nifty sustains above the pivot zone (56,648), it may trigger renewed buying interest, potentially pushing the index toward R1 (57,007) and higher levels like R2 (57,484) and R3 (57,865).
❌ Bearish Scenario:
A breakdown below the lower end of the pivot zone at 56,411 may attract selling pressure, dragging the index towards S1 (56,055) and possibly lower levels like S2 (55,582) and S3 (55,086).
Disclaimer: lnkd.in
BANK NIFTY S/R for 28/7/25Support and Resistance Levels:
Support Levels: These are price points (green line/shade) where a downward trend may be halted due to a concentration of buying interest. Imagine them as a safety net where buyers step in, preventing further decline.
Resistance Levels: Conversely, resistance levels (red line/shade) are where upward trends might stall due to increased selling interest. They act like a ceiling where sellers come in to push prices down.
Breakouts:
Bullish Breakout: When the price moves above resistance, it often indicates strong buying interest and the potential for a continued uptrend. Traders may view this as a signal to buy or hold.
Bearish Breakout: When the price falls below support, it can signal strong selling interest and the potential for a continued downtrend. Traders might see this as a cue to sell or avoid buying.
MA Ribbon (EMA 20, EMA 50, EMA 100, EMA 200) :
Above EMA: If the stock price is above the EMA, it suggests a potential uptrend or bullish momentum.
Below EMA: If the stock price is below the EMA, it indicates a potential downtrend or bearish momentum.
Trendline: A trendline is a straight line drawn on a chart to represent the general direction of a data point set.
Uptrend Line: Drawn by connecting the lows in an upward trend. Indicates that the price is moving higher over time. Acts as a support level, where prices tend to bounce upward.
Downtrend Line: Drawn by connecting the highs in a downward trend. Indicates that the price is moving lower over time. It acts as a resistance level, where prices tend to drop.
Disclaimer:
I am not SEBI registered. The information provided here is for learning purposes only and should not be interpreted as financial advice. Consider the broader market context and consult with a qualified financial advisor before making investment decisions.

BankNifty levels - Jul 28, 2025Utilizing the support and resistance levels of BankNifty, along with the 5-minute timeframe candlesticks and VWAP, can enhance the precision of trade entries and exits on or near these levels. It is crucial to recognize that these levels are not static, and they undergo alterations as market dynamics evolve.
The dashed lines on the chart indicate the reaction levels, serving as additional points of significance. Furthermore, take note of the response at the levels of the High, Low, and Close values from the day prior.
We trust that this information proves valuable to you.
* If you found the idea appealing, kindly tap the Boost icon located below the chart. We encourage you to share your thoughts and comments regarding it.
Wishing you successful trading endeavors!

[INTRADAY] #BANKNIFTY PE & CE Levels(25/07/2025)Bank Nifty is likely to start the session with a slight gap-down, hovering just below the 57,050–57,100 resistance zone. This zone has been acting as a critical barrier over the past sessions, and until it's breached, upside momentum may remain capped.
A strong bullish move can be anticipated above 57,050, where call option buying is favored. If Bank Nifty sustains this breakout, we can expect a continuation rally toward 57,250, 57,350, and 57,450+ levels. This would mark a short-term trend reversal and signal fresh bullish interest.
On the downside, weakness may resume if the index breaks below the 56,950 mark. A sustained move below this could trigger a quick correction targeting 56,750, 56,650, and 56,550- levels, offering good opportunities for put option buyers.

Bank Nifty bounce from AVWAP After sharp correction BANK nifty finally bounce from Anchored Vwap support if hold this level probability high to outperform .

BANKNIFTYThe movement slope of the chart is constantly over the time therefore it is not possible to find the next tops by using the simple trend lines.
Thus it may be a better idea to use curved lines instead of straight lines.
Now we draw again. by doing it this way, we were able to find the exact location of the next 2-3 Tops or Bottoms in the chart.

#Banknifty directions and levels for August 4th:
What can we expect today?
In the previous session, both Nifty and Bank Nifty closed with a negative bias.
However, today’s market is indicating a gap-up start of around 80 points. Structurally, if this gap-up doesn't sustain,
we can expect the correction to continue, possibly with some consolidation.
On the other hand, if the gap-up sustains and breaks the 38% Fibonacci level with a solid candle or after some consolidation,
we can expect a pullback of at least 50% to 78% in the minor swing.
In this case, even if the market takes a pullback but fails to break the 38% Fibonacci level,
another round of correction may follow.

Banknifty August 1st week analysisBanknifty is looking uncertain and we can expect high volatility in banknifty in the upcoming week.If banknifty breaches 55400 on the downside then an important level to watch on downside would be 54876. On the upside if banknifty crosses and sustains above 55800-56014 then we can expect upside upto 55560-56700.
All levels are marked in the chart posted.
