Banknifty May 2nd Week Analysis Banknifty is looking uncertain. But due to global and geopolitical tensions easing,we can expect Banknifty to show good short covering.
IMP TO NOTE : If Banknifty is able to cross and sustain above 54150,then we can expect further upside upto 54800-55100+
Profit booking at higher levels are expected in banknifty , especially at 54800-55200 zone.
BANKNIFTY trade ideas

BNF 55304 Trend directionBNF 55304 Has breakout from round top pattern and is moving to its technical target of 56239. As FII's have started winding up contracts and profit booking we expect BNF will be moved to its technical target before reversing

Bank Nify levels for 12/05/2025🧭 Overall Market Structure:
The chart shows strong upward movement earlier, followed by a sharp reversal and ongoing consolidation near support.
The price is currently around 53,674, testing a demand/support zone.
📉 Trend Overview (from the panel):
Timeframe -Trend
D (Daily) - Bullish
4H - Bullish
1H - Bearish
15M - Bearish
5M Bearish
This suggests short-term bearishness, but higher timeframes remain bullish, indicating a pullback within an uptrend.
🔻 Resistance Levels (Marked in Red):
56,098.70 - 55,557.75
55,691.95
54,937.25 - 54,723.70
54,176.45
53,919.90
These levels indicate stacked supply zones, showing strong overhead resistance. Price was rejected near these zones repeatedly, confirming bearish pressure.
🔼 Support Levels (Marked in Blue/Purple):
53,400 area (current price testing support zone)
Lower HTF supports at:
51,893.60
50,742.00
These are key demand levels from higher timeframes. If price loses the 53,400 zone, it may drop towards 51,893 and even 50,742.
📍 Price Action & Candlestick Structure:
A series of lower highs and lower lows forming recently.
Candles near current levels are tight-bodied, indicating indecision.
A bullish bounce from current support is possible, but a breakdown would confirm continuation to the downside.
🧠 Summary:
Trend: Bullish on higher timeframes, Bearish on lower.
Action Zone: Price at major support (53,400)—crucial decision area.
Bias:
Bullish bounce possible toward 54,100–54,700 if support holds.
Bearish continuation likely below 53,400, targets 51,900 and 50,700.

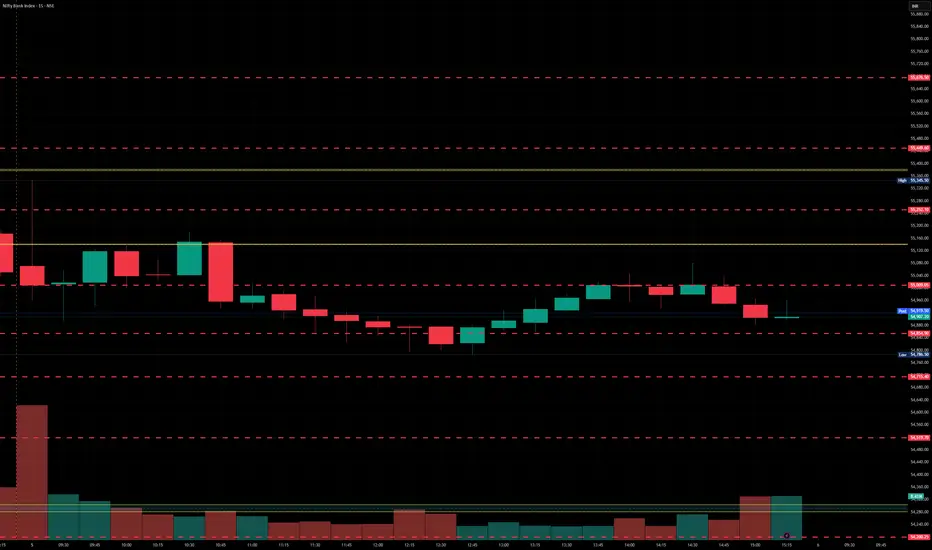
BankNifty levels - May 12, 2025Utilizing the support and resistance levels of BankNifty, along with the 5-minute timeframe candlesticks and VWAP, can enhance the precision of trade entries and exits on or near these levels. It is crucial to recognize that these levels are not static, and they undergo alterations as market dynamics evolve.
The dashed lines on the chart indicate the reaction levels, serving as additional points of significance. Furthermore, take note of the response at the levels of the High, Low, and Close values from the day prior.
We trust that this information proves valuable to you.
* If you found the idea appealing, kindly tap the Boost icon located below the chart. We encourage you to share your thoughts and comments regarding it.
Wishing you successful trading endeavors!
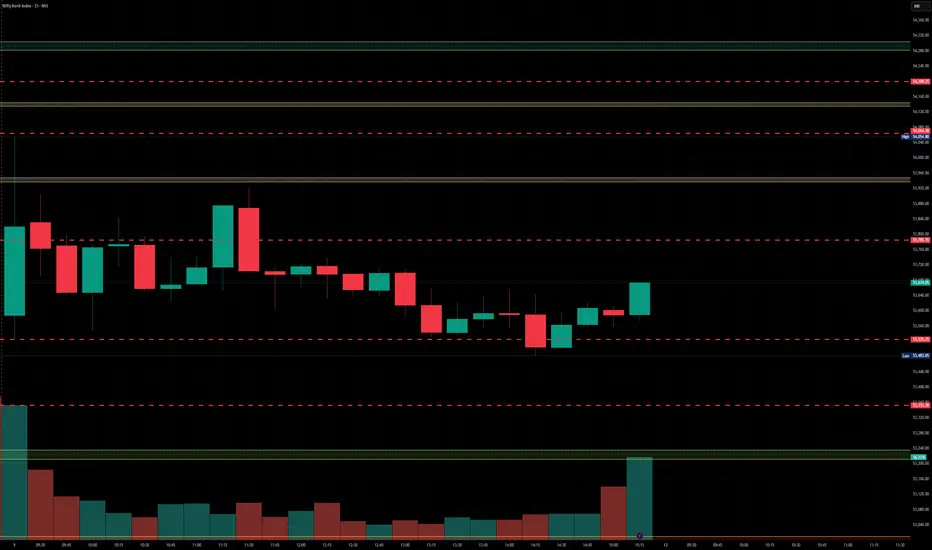
[INTRADAY] #BANKNIFTY PE & CE Levels(09/05/2025)Today will be gap down opening expected in banknifty. Expected opening near 54000 level. After opening if banknifty started trading below 53950 level then expected further downside rally upto 53550 level and this can be extend for further 400-500+ points if it gives breakdown of 53450 level. Any upside movement expected if banknifty sustain above 54050 level.


BankNifty levels - May 09, 2025Utilizing the support and resistance levels of BankNifty, along with the 5-minute timeframe candlesticks and VWAP, can enhance the precision of trade entries and exits on or near these levels. It is crucial to recognize that these levels are not static, and they undergo alterations as market dynamics evolve.
The dashed lines on the chart indicate the reaction levels, serving as additional points of significance. Furthermore, take note of the response at the levels of the High, Low, and Close values from the day prior.
We trust that this information proves valuable to you.
* If you found the idea appealing, kindly tap the Boost icon located below the chart. We encourage you to share your thoughts and comments regarding it.
Wishing you successful trading endeavors!

[INTRADAY] #BANKNIFTY PE & CE Levels(08/05/2025)Flat opening in banknifty. After opening if banknifty sustain above 54550 level then expected upside movement upto 54950+ level in opening session. Downside movement expected if banknifty starts trading below 54450 level. Downside 54050 level will act as an important support for today's session. Any major downside only expected below this support level.

Bank Nifty - Updated for Next Weekly LevelsCurrent Price: 54664.05
Mid-Point: 54763.5
Upside: 56369.50, 57111.7, 57992.27 and 58872.85
Downside: 53160.43, 52415.3, 51534.72 and 50654.15

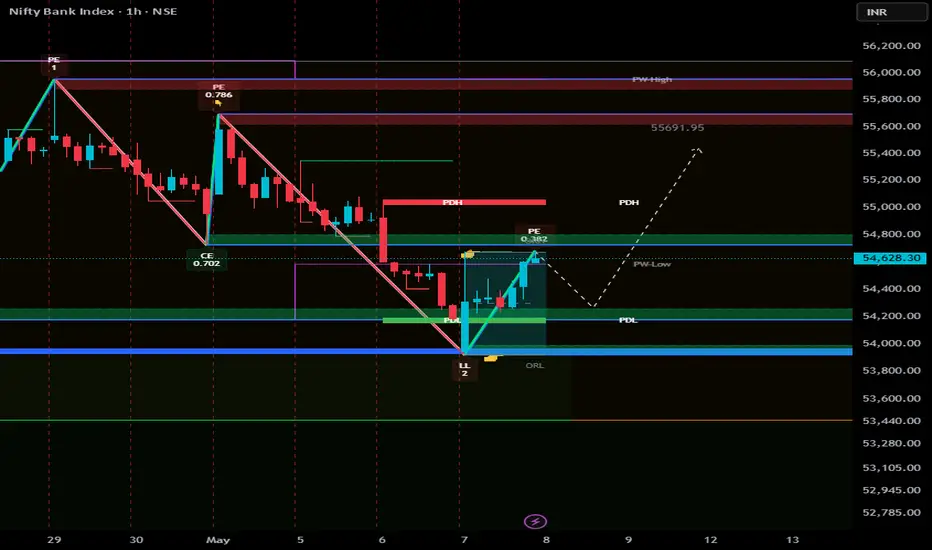
Next strike on 55690Market Update: Bank Nifty Outlook
Today, following news of an Indian Army operation, Bank Nifty witnessed a significant gap-down opening. However, it quickly recovered and moved upward with strong momentum.
Currently, based on the chart structure, we require the formation of a higher low to confirm the next leg of the uptrend toward the 55,690 level. If Bank Nifty opens flat in the next session, there is a strong potential for a sustained rally on the upside.
We advise closely monitoring price action around key support zones for confirmation.
BankNifty levels - May 05, 2025Utilizing the support and resistance levels of BankNifty, along with the 5-minute timeframe candlesticks and VWAP, can enhance the precision of trade entries and exits on or near these levels. It is crucial to recognize that these levels are not static, and they undergo alterations as market dynamics evolve.
The dashed lines on the chart indicate the reaction levels, serving as additional points of significance. Furthermore, take note of the response at the levels of the High, Low, and Close values from the day prior.
We trust that this information proves valuable to you.
* If you found the idea appealing, kindly tap the Boost icon located below the chart. We encourage you to share your thoughts and comments regarding it.
Wishing you successful trading endeavors!

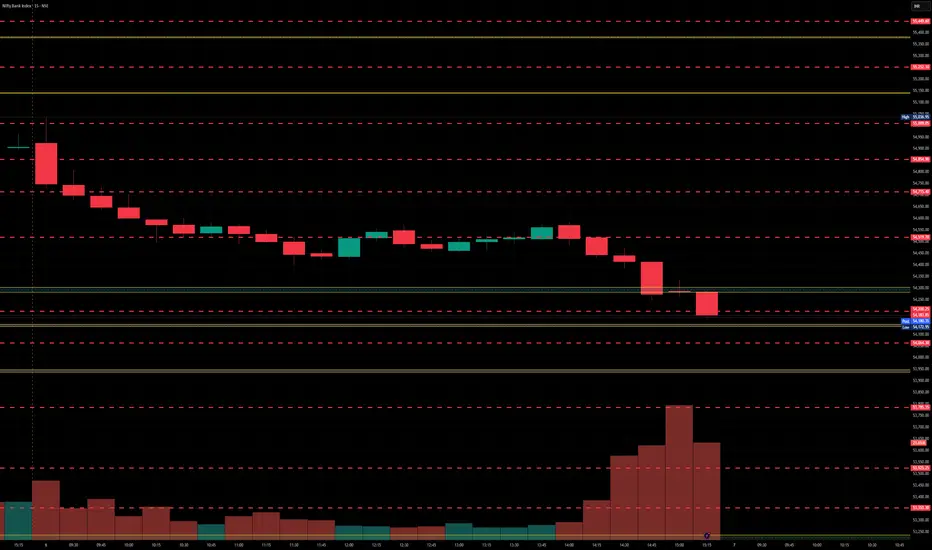
[INTRADAY] #BANKNIFTY PE & CE Levels(07/05/2025)Today will be slightly gap down opening expected in index. Expected opening near 54000 level. After opening if banknifty starts trading below 53950 level then possible strong downside movement in index upto 53550 level. Any bullish side movement expected if banknifty starts trading and sustain above 54550 level.

BankNifty levels - May 07, 2025Utilizing the support and resistance levels of BankNifty, along with the 5-minute timeframe candlesticks and VWAP, can enhance the precision of trade entries and exits on or near these levels. It is crucial to recognize that these levels are not static, and they undergo alterations as market dynamics evolve.
The dashed lines on the chart indicate the reaction levels, serving as additional points of significance. Furthermore, take note of the response at the levels of the High, Low, and Close values from the day prior.
We trust that this information proves valuable to you.
* If you found the idea appealing, kindly tap the Boost icon located below the chart. We encourage you to share your thoughts and comments regarding it.
Wishing you successful trading endeavors!
Bank Nifty Short Trade – All Targets Achieved✅ Bank Nifty Short Trade – All Targets Achieved
📉 Setup Type: FVG Rejection + MSS Breakdown
🕒 Timeframe: 15-Minute
📊 Market Bias: Bearish
📍 Entry Price: ₹55,144.20
🔴 Stop Loss: ₹55,386.10
🎯 Targets:
• Target 1 Hit – ₹54,934.80
• Target 2 Hit – ₹54,725.40
• Final Target 3 ✅ ₹54,516.00 ✔️
🧠 Trade Breakdown:
BankNifty rejected from the Fair Value Gap (FVG) zone, followed by a clear Market Structure Shift (MSS). Price consistently traded below the EMA ribbon, confirming the bearish momentum.
This setup played out exactly as planned with all 3 targets being cleanly hit.
📈 Key Highlights:
✔️ Rejection from FVG
✔️ EMA + Structure Confirmation
✔️ MSS + Strong Momentum
✔️ Clear Risk-to-Reward Execution
🟢 Conclusion:
A textbook short setup – clean structure, solid confirmation, and disciplined execution.
Such precise setups don’t come every day!

[INTRADAY] #BANKNIFTY PE & CE Levels(06/05/2025)Today will be flat opening in index. After opening if banknifty starts trading and sustain above 55050 level then expected upside movement upto 55450+ level in opening session. Major downside expected if banknifty not sustain above level and starts trading below 54950 then possible downside upto 54550 support level.

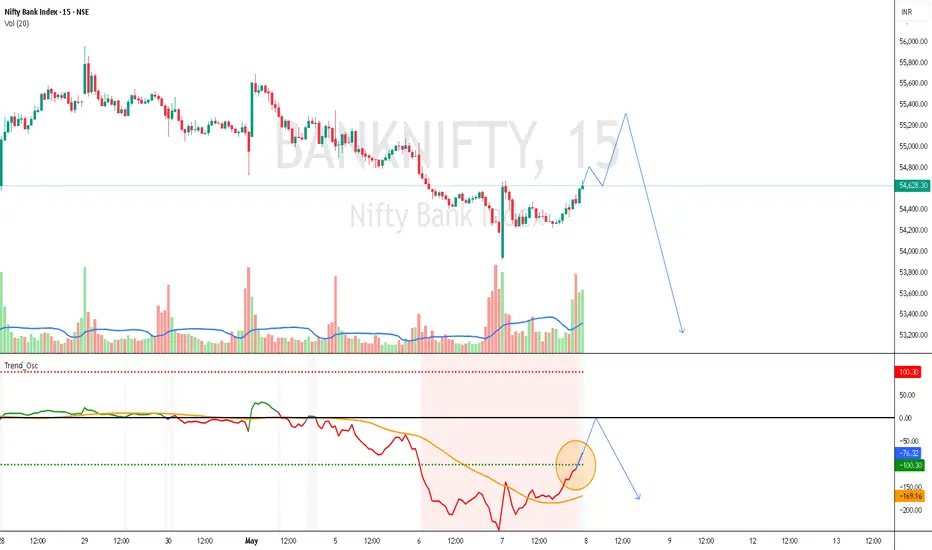
NIFTY50BANK NIFTY INDEX
- Bearish Channel as an corrective pattern in Short Time Frame
- Break of Structure
- RSI - Divergence
- Change of Characteristics
- Completed " 12345 " Impulsive Waves

BankNifty levels - May 06, 2025Utilizing the support and resistance levels of BankNifty, along with the 5-minute timeframe candlesticks and VWAP, can enhance the precision of trade entries and exits on or near these levels. It is crucial to recognize that these levels are not static, and they undergo alterations as market dynamics evolve.
The dashed lines on the chart indicate the reaction levels, serving as additional points of significance. Furthermore, take note of the response at the levels of the High, Low, and Close values from the day prior.
We trust that this information proves valuable to you.
* If you found the idea appealing, kindly tap the Boost icon located below the chart. We encourage you to share your thoughts and comments regarding it.
Wishing you successful trading endeavors!
BANK NIFTY 54000-53800BANK NIFTY 54000-53800
Current Price: ₹55,115.35
Day's Range: ₹54,994.40 – ₹55,691.95
52-Week Range: ₹46,077.85 – ₹56,098.70
Technical Indicators: Strong sell signals

[INTRADAY] #BANKNIFTY PE & CE Levels(05/05/2025)Today will be gap up opening in banknifty. After opening if banknifty sustain above 55050 level then upside movement upto 55450+ level expected and this can be extend for further 400-500+ points in case banknifty starts trading above 55550 level. Any major downside only expected below 54950 level.

Banknifty May 1st Week AnalysisAfter losing momentum at 56000 for 2 consecutive weeks, I expect Banknifty to retrace up to 53500 in the upcoming week. The only scenario to avert this retracement would be that Banknifty closes above 55600 on a daily basis and crosses 56200. Then, we can expect a new all-time high of 57000+.

Bank Nifty Breakout 56100 or breakdown 54250 .. what next !!Bank Nifty Technical Outlook:
Bank Nifty is currently forming a lower high and higher low pattern, indicating a symmetrical triangle formation. The trading range is getting increasingly narrower, suggesting that a decisive breakout is imminent on either side.
Downside Scenario:
If Bank Nifty breaks down below 54,200, we could see a retracement towards the 52,930 – 52,300 levels, where multiple virgin CPRs (Central Pivot Ranges) are present, potentially acting as support zones.
Traders should closely monitor price action near the current range boundaries for confirmation of direction.
