BANKNIFTY APRIL 2ND WEEK ANALYSISBanknifty is looking positive, but as we have already discussed in the Nifty weekly analysis about global uncertainty ,we can expect Banknifty to form a low near 50540 . But if Banknifty breaches 50544, then we can witness a new range to open , which I have specially marked below . There are 3 levels to watch in Banknifty if it breaks below 50544:
1.) 50028
2.) 49392
3.) 48922
But if Banknifty manages to secure 50544, then we can expect a green weekly closing in Banknifty.
BANKNIFTY trade ideas

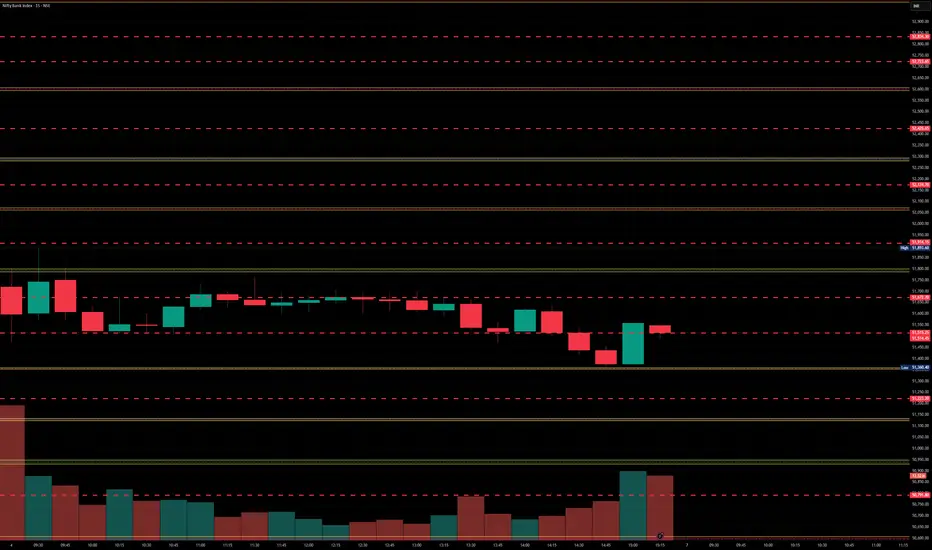
BankNifty levels - Apr 07, 2025Utilizing the support and resistance levels of BankNifty, along with the 5-minute timeframe candlesticks and VWAP, can enhance the precision of trade entries and exits on or near these levels. It is crucial to recognize that these levels are not static, and they undergo alterations as market dynamics evolve.
The dashed lines on the chart indicate the reaction levels, serving as additional points of significance. Furthermore, take note of the response at the levels of the High, Low, and Close values from the day prior.
We trust that this information proves valuable to you.
* If you found the idea appealing, kindly tap the Boost icon located below the chart. We encourage you to share your thoughts and comments regarding it.
Wishing you successful trading endeavors!
[INTRADAY] #BANKNIFTY PE & CE Levels(04/04/2025)Today will be gap down opening in banknifty. After opening if banknifty starts trading below 51450 level then expected downside upto 51050 level. For today's session 51000 level will act as a strong support for banknifty. Any major downside only expected below 50950 level. Strong upside rally possible if index starts trading and sustain above 51550 level.

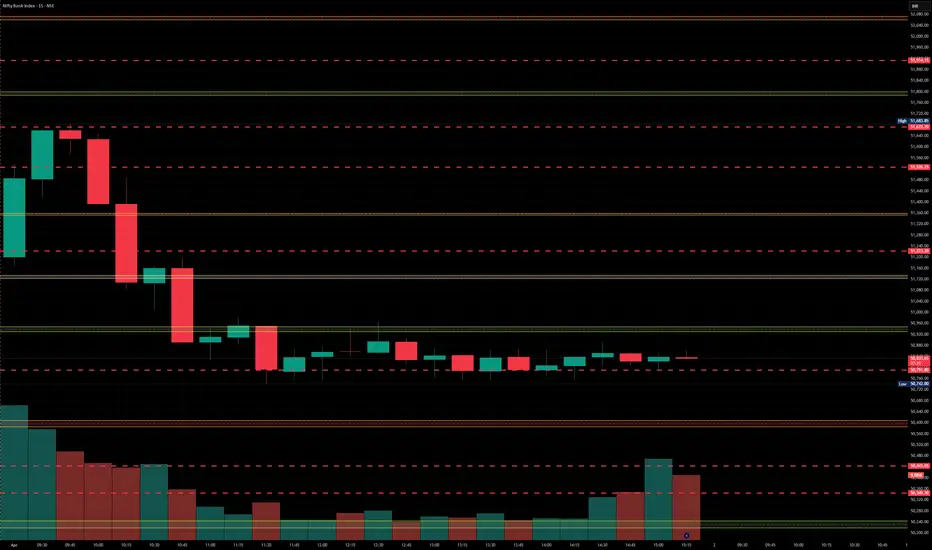
BankNifty levels - Apr 04, 2025Utilizing the support and resistance levels of BankNifty, along with the 5-minute timeframe candlesticks and VWAP, can enhance the precision of trade entries and exits on or near these levels. It is crucial to recognize that these levels are not static, and they undergo alterations as market dynamics evolve.
The dashed lines on the chart indicate the reaction levels, serving as additional points of significance. Furthermore, take note of the response at the levels of the High, Low, and Close values from the day prior.
We trust that this information proves valuable to you.
* If you found the idea appealing, kindly tap the Boost icon located below the chart. We encourage you to share your thoughts and comments regarding it.
Wishing you successful trading endeavors!

[INTRADAY] #BANKNIFTY PE & CE Levels(03/04/2025)Today will be gap down opening expected in index. Expected opening near 51000 level. After opening if banknifty sustain above 51050 level then possible upside movement upto 51450 in opening session. But in case banknifty starts trading below 50950 level then expected sharp downside movement upto 400-500+ points and this can extend further upto 50050 in case it gives breakdown of 50450 level.

bank nifty down 50000 or up 52500bank nifty down 50000 or up 52500
index that represents the performance of the banking sector in India. It includes the most liquid and large-cap banking stocks listed

BankNifty levels - Apr 03, 2025Utilizing the support and resistance levels of BankNifty, along with the 5-minute timeframe candlesticks and VWAP, can enhance the precision of trade entries and exits on or near these levels. It is crucial to recognize that these levels are not static, and they undergo alterations as market dynamics evolve.
The dashed lines on the chart indicate the reaction levels, serving as additional points of significance. Furthermore, take note of the response at the levels of the High, Low, and Close values from the day prior.
We trust that this information proves valuable to you.
* If you found the idea appealing, kindly tap the Boost icon located below the chart. We encourage you to share your thoughts and comments regarding it.
Wishing you successful trading endeavors!

[INTRADAY] #BANKNIFTY PE & CE Levels(02/04/2025)Today will be slightly gap up opening expected in index near 51000 level. After opening it will face strong resistance at this level and expected reversal direction towards the 50550 level. This downside rally can extend for further 400-500+ points in case banknifty starts trading below 50450 level. Any bullish side rally only expected if banknifty starts trading and sustain above 51050 level.

BANKNIFTY : Trading Levels and Plan for 31-Mar-2025📌 BANK NIFTY Trading Plan – 31-Mar-2025
📊 Market Overview:
Bank Nifty closed at 51,552, trading within a consolidation phase near the Opening Support/Resistance Zone (51,552 – 51,564). The price action at key levels will dictate the next move, so we need to be prepared for different opening scenarios.
This plan offers a structured approach to trading at key levels while maintaining a favorable risk-reward ratio.
🔼 Scenario 1: Gap-Up Opening (200+ points above 51,750)
A gap-up above 51,750 suggests bullish momentum, but sustainability above the resistance zone (51,848 - 52,129) is crucial for further upside. If price faces rejection, an intraday reversal is possible.
✅ Plan of Action:
If Bank Nifty sustains above 52,129, expect an up-move towards the next resistance at 52,335. A breakout above 52,335 could trigger a rally towards 52,500+.
If price faces rejection at 52,129 and reverses, expect a retracement towards 51,848 → 51,750. If it fails to hold 51,750, a deeper correction towards 51,552 is possible.
Avoid fresh longs inside 51,848 – 52,129, as this zone could act as a profit-booking area. Wait for a decisive breakout or rejection confirmation.
🎯 Pro Tip: If the gap-up is quickly filled within the first 15-30 minutes, it signals weak buying strength, increasing the probability of an intraday correction.
⚖ Scenario 2: Flat Opening (Within ±200 points, around 51,550)
A flat opening near 51,552 indicates indecision. The market will take direction after the first few candles, so breakouts or breakdowns from key levels should be watched.
✅ Plan of Action:
Upside case: If Bank Nifty breaks and sustains above 51,848, it may head towards 52,129 → 52,335. Observe price action near these resistance levels before entering fresh longs.
Downside case: If Bank Nifty breaks below 51,552, it could test 51,199 → 50,899. A breakdown below 50,899 will shift the trend bearish.
Sideways caution: If the market remains inside the No Trade Zone (51,564 – 51,848), avoid taking trades as volatility could trap both buyers and sellers.
🎯 Pro Tip: In a flat opening, wait for a clear 15-minute candle close above or below key levels before entering trades.
🔽 Scenario 3: Gap-Down Opening (200+ points below 51,350)
A gap-down below 51,350 could signal profit booking or fresh selling pressure. The critical factor will be whether buyers defend key support zones.
✅ Plan of Action:
If price sustains below 51,350, expect a decline towards 51,199 → 50,899. A breakdown below 50,899 may accelerate selling towards the Must Try Zone for Buyers (50,800 – 50,899).
If price finds support at 50,899 and rebounds, it may attempt a recovery towards 51,199 → 51,552. A strong close above 51,552 could shift momentum back to the bulls.
Be cautious of bear traps – If the market gaps down but quickly recovers, it could trigger short covering, leading to an upside reversal.
🎯 Pro Tip: If the gap-down occurs near a strong buyer’s support zone, wait for a bullish price action confirmation before entering long trades.
⚠️ Risk Management Tips for Options Traders
🔹 Avoid over-leveraging – Use proper position sizing to manage risk.
🔹 Theta Decay Awareness – If the market consolidates, option premiums will erode rapidly.
🔹 Use Spreads for Protection – Instead of naked options, use spreads to limit risk and improve probability.
🔹 Trade at Key Levels – Avoid impulsive trades; focus on defined support and resistance zones.
📌 Summary & Conclusion
📍 Key Levels to Watch:
🟥 Resistance: 52,129 → 52,335 → 52,500
🟧 No Trade Zone: 51,564 – 51,848
🟩 Support: 51,199 → 50,899 → 50,800
🔸 Bullish Bias: Above 52,129, targeting 52,335 – 52,500
🔸 Bearish Bias: Below 51,350, expecting a fall towards 51,199 – 50,899
🔸 Neutral/Choppy: Inside 51,564 – 51,848, avoid unnecessary trades
🎯 Final Advice:
Stick to the structured trading plan and execute only at key levels.
Avoid emotional trading—wait for confirmation before entering trades.
The first 15-30 minutes after market open will provide better clarity—observe price action before committing to a trade.
📢 Disclaimer
I am not a SEBI-registered analyst. This trading plan is for educational purposes only. Please conduct your own research or consult a financial advisor before making any trades.

BankNifty level - Apr 02, 2025Utilizing the support and resistance levels of BankNifty, along with the 5-minute timeframe candlesticks and VWAP, can enhance the precision of trade entries and exits on or near these levels. It is crucial to recognize that these levels are not static, and they undergo alterations as market dynamics evolve.
The dashed lines on the chart indicate the reaction levels, serving as additional points of significance. Furthermore, take note of the response at the levels of the High, Low, and Close values from the day prior.
We trust that this information proves valuable to you.
* If you found the idea appealing, kindly tap the Boost icon located below the chart. We encourage you to share your thoughts and comments regarding it.
Wishing you successful trading endeavors!
Bank Nifty SPOTBank Nifty SPOT
MTF Analysis
Bank NiftyYearly Demand 41,830
Bank Nifty 6 Month Demand 41,830
Bank NiftyQtrly Demand BUFL 48,450
Bank NiftyMonthly Demand 44,764
Bank NiftyWeekly Demand 46,990
Bank NiftyWeekly Demand 49,683
Bank NiftyDaily Demand DMIP 50,155
ENTRY -1 Long 50,155
SL 49,771
RISK 384
Target as per Entry 56,425
RR 16
Last High 52,068
Last Low 47,711

[INTRADAY] #BANKNIFTY PE & CE Levels(01/04/2025)Today will be flat or slightly gap down opening expected in index. After opening important level for banknifty is around 51500. If banknifty starts trading below 51450 level then expected downside movement upto 51050 level in today's session. Similarly if banknifty starts trading and sustain above 51550 level then there will be upside bullish rally upto 51950+ level possible.

Banknifty April 1st week analysis.Banknifty is looking positive on charts. Hence, we can expect upside momentum to continue, but some global uncertainties and a truncated week can hamper momentum . Levels to watch:
Upside only if Banknifty crosses and sustains above 51750, and momentum can continue upto 52500+. On the downside, we can expect retracement upto 50800 if Banknifty breaches the range of 51370-250. All levels are marked in the chart posted.

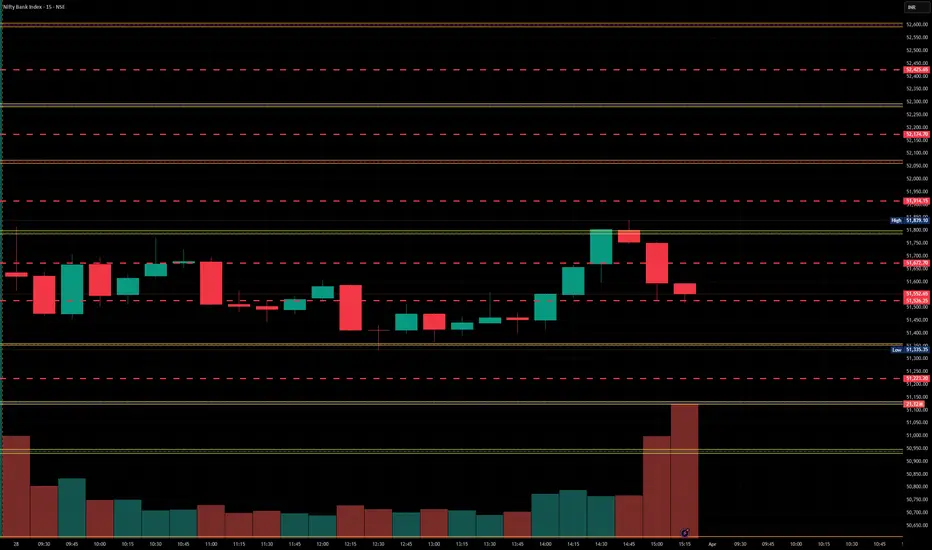
BankNifty levels - Apr 01, 2025Utilizing the support and resistance levels of BankNifty, along with the 5-minute timeframe candlesticks and VWAP, can enhance the precision of trade entries and exits on or near these levels. It is crucial to recognize that these levels are not static, and they undergo alterations as market dynamics evolve.
The dashed lines on the chart indicate the reaction levels, serving as additional points of significance. Furthermore, take note of the response at the levels of the High, Low, and Close values from the day prior.
We trust that this information proves valuable to you.
* If you found the idea appealing, kindly tap the Boost icon located below the chart. We encourage you to share your thoughts and comments regarding it.
Wishing you successful trading endeavors!
[INTRADAY] #BANKNIFTY PE & CE Levels(28/03/2025)Today will be gap up opening expected in banknifty. After opening if banknifty starts trading above 52050 level then expected strong upside rally upto 52450+ level. any major downside only expected below 51450 level.

BANKNIFTY - Trading Levels and Plan for 28-Mar-2025📌 BANK NIFTY Trading Plan – 28-Mar-2025
📊 Market Overview:
Bank Nifty closed at 51,534, consolidating within a No Trade Zone after a sharp rally. The index is currently at a decision point, where price action at key levels will determine the next move.
This structured plan will help you trade effectively under different opening conditions.
🔼 Scenario 1: Gap-Up Opening (200+ points above 51,750)
A gap-up opening above 51,750 would place Bank Nifty near the Opening Resistance Zone (51,851). The key focus should be on whether the index sustains above resistance or faces rejection.
✅ Plan of Action:
If Bank Nifty sustains above 51,851, it could trigger a rally towards the Profit Booking Zone (52,185 – 52,335). A breakout above this level may extend gains to 52,500+.
If price faces rejection at 51,851 and reverses, it could lead to a pullback towards 51,593 → 51,534. Watch for support confirmation before taking any long positions.
Avoid aggressive longs inside 51,750 – 51,851, as this area could witness profit booking. Wait for a proper retest before entering trades.
🎯 Pro Tip: If the gap-up gets filled within 15 minutes, it signals weak buying strength and may lead to intraday correction.
⚖ Scenario 2: Flat Opening (Within ±200 points, around 51,534)
A flat opening suggests that market participants are waiting for confirmation before taking decisive action. In such cases, it's best to trade only at key breakout/breakdown levels.
✅ Plan of Action:
Upside case: If Bank Nifty breaks and sustains above 51,593, it could move towards 51,750 → 51,851. Observe the price action at these levels before deciding on further longs.
Downside case: If Bank Nifty breaks below 51,534, it could test 51,388. A breakdown below 51,388 may trigger selling towards 51,205.
Sideways caution: If the index trades between 51,534 – 51,593, it indicates a choppy market. Avoid trading inside this range unless there is a clear breakout.
🎯 Pro Tip: In a flat opening scenario, wait for at least one 15-minute candle close to confirm the direction before entering a trade.
🔽 Scenario 3: Gap-Down Opening (200+ points below 51,334)
A gap-down below 51,334 could indicate weakness and profit booking, bringing the index closer to key support zones. The next move depends on whether buyers defend these supports.
✅ Plan of Action:
If price sustains below 51,334, expect a decline towards 51,205. A breakdown below 51,205 could lead to a deeper correction towards the Buyer’s Support Zone (50,987 – 50,891).
If price rebounds from 51,205, it may attempt a recovery towards 51,388 → 51,534. A strong close above 51,534 could invalidate bearish sentiment.
Be cautious of bear traps – If price quickly recovers after a sharp gap-down, it may indicate short covering, leading to an upside reversal.
🎯 Pro Tip: If the gap-down occurs near a strong buyer’s support zone, look for signs of reversal before initiating new shorts.
⚠️ Risk Management Tips for Options Traders
🔹 Avoid over-leveraging – Stick to a fixed capital allocation per trade to reduce risk.
🔹 Theta Decay Awareness – If the market consolidates, option premiums will decay rapidly, impacting option buyers.
🔹 Use Spreads for Protection – Instead of naked options, use spreads to control risk.
🔹 Trade at Key Levels – Avoid random trades; enter only near strong support and resistance zones.
📌 Summary & Conclusion
📍 Key Levels to Watch:
🟥 Resistance: 51,851 → 52,185 → 52,335
🟧 No Trade Zone: 51,534 – 51,593
🟩 Support: 51,388 → 51,205 → 50,987
🔸 Bullish Bias: Above 51,851, targeting 52,185 – 52,335
🔸 Bearish Bias: Below 51,334, expecting a fall towards 51,205 – 50,987
🔸 Neutral/Choppy: Inside 51,534 – 51,593, avoid unnecessary trades
🎯 Final Advice:
Stick to the structured trading plan and execute only at key levels.
Avoid FOMO trades—wait for confirmation before entering.
The first 15-30 minutes after market open will give a clearer direction—observe price action before committing to a trade.
📢 Disclaimer
I am not a SEBI-registered analyst. This trading plan is for educational purposes only. Please conduct your own research or consult a financial advisor before making any trades.

BankNifty levels - Mar 28, 2025Utilizing the support and resistance levels of BankNifty, along with the 5-minute timeframe candlesticks and VWAP, can enhance the precision of trade entries and exits on or near these levels. It is crucial to recognize that these levels are not static, and they undergo alterations as market dynamics evolve.
The dashed lines on the chart indicate the reaction levels, serving as additional points of significance. Furthermore, take note of the response at the levels of the High, Low, and Close values from the day prior.
We trust that this information proves valuable to you.
* If you found the idea appealing, kindly tap the Boost icon located below the chart. We encourage you to share your thoughts and comments regarding it.
Wishing you successful trading endeavors!
[INTRADAY] #BANKNIFTY PE & CE Levels(27/03/2025)Today will be slightly gap down opening expected in index. After opening possible banknifty consolidate in between the 51050-51450 level in today's session. Any upside rally only expected if banknifty starts trading and sustain above 51550 level. Major downside expected in index if it's give breakdown of 50950 level. This downside rally can goes upto 50550 level.

BANKNIFTY : Levels and Plan for 27-Mar-2025
📊 Current Market Status:
Bank Nifty closed at 51,180.70, showing a slight decline after testing resistance zones. The index is currently in a critical decision zone, where price action at key levels will determine the next directional move.
Let’s analyze the trading plan for different opening scenarios and set up a structured approach to trade safely.
🔼 Scenario 1: Gap-Up Opening (200+ points above 51,400)
If Bank Nifty opens above 51,400, it will directly test the Opening Resistance (51,424 – 51,564). This zone has previously acted as a supply area, so we need to see if bulls can sustain above it.
✅ Plan of Action:
If price sustains above 51,564, it can trigger further upside momentum towards 51,851 (Last Intraday Resistance). A breakout above 51,851 may lead to a sharp rally towards 52,100+ levels.
If price gets rejected at 51,564 and starts reversing, look for shorting opportunities, targeting 51,424 → 51,271 → 51,180.
Avoid aggressive long trades if price fluctuates within 51,424 – 51,564 (sideways resistance), as this could indicate a choppy range.
🎯 Pro Tip: If the gap-up is weak and starts filling within 15 minutes, expect a retracement towards the Opening Support (51,218 – 51,271) before making a trading decision.
⚖ Scenario 2: Flat Opening (Within ±200 points, around 51,180)
A flat opening suggests a balanced market, and Bank Nifty will need confirmation before picking a clear direction.
✅ Plan of Action:
Upside case: If Bank Nifty breaks above 51,424, we could see a move towards 51,564, where price action must be observed for further bullish strength.
Downside case: If price breaks below 51,218, expect a retest of the Opening Support Zone (50,904 – 51,218). A breakdown below this zone can trigger selling towards 50,522.
Neutral/Wait & Watch: If the index trades inside the No Trade Zone (50,904 – 51,218), avoid unnecessary trades.
🎯 Pro Tip: A flat opening often leads to fake breakouts in the first 15 minutes. Wait for a confirmed breakout with volume before entering.
🔽 Scenario 3: Gap-Down Opening (200+ points below 50,900)
If Bank Nifty opens below 50,900, it will enter a high-risk zone, with major support at 50,522 (Wave 4 Upper Band).
✅ Plan of Action:
If price sustains below 50,904, expect a test of 50,522. A further breakdown could lead to heavy selling towards 50,300 – 50,100 levels.
If price takes support at 50,522 and rebounds, look for a possible pullback trade, targeting 50,904 → 51,180.
Be cautious of bear traps—if price quickly reverses after a sharp gap-down, it might indicate a short-covering rally.
🎯 Pro Tip: In a gap-down scenario, avoid panic selling. Watch for reversals from key support levels before shorting further.
⚠️ Risk Management Tips for Options Traders
🔹 Avoid over-leveraging – Keep your position sizing in check to prevent excessive losses.
🔹 Theta Decay Awareness – If the market is consolidating, option premiums will decay rapidly.
🔹 Hedge Your Trades – Instead of naked options, use spreads to reduce risk.
🔹 Wait for Confirmation – Don't enter trades impulsively; wait for a breakout or breakdown retest.
📌 Summary & Conclusion
📍 Key Levels to Watch:
🟥 Resistance: 51,424 → 51,564 → 51,851 → 52,100
🟧 No Trade Zone: 50,904 – 51,218
🟦 Support: 50,904 → 50,522 → 50,300
🔸 Bullish Bias: Above 51,564 for targets of 51,851 – 52,100
🔸 Bearish Bias: Below 50,904 for a move towards 50,522 – 50,300
🔸 Neutral/Sideways: If price stays between 50,904 – 51,218, expect range-bound action.
🎯 Final Advice:
Stick to the plan, follow key levels, and don't chase trades.
Avoid trading inside No Trade Zones.
Let the market settle for 15-30 minutes before making aggressive moves.
📢 Disclaimer
I am not a SEBI-registered analyst. This trading plan is for educational purposes only. Please do your research or consult a financial advisor before making trading decisions.

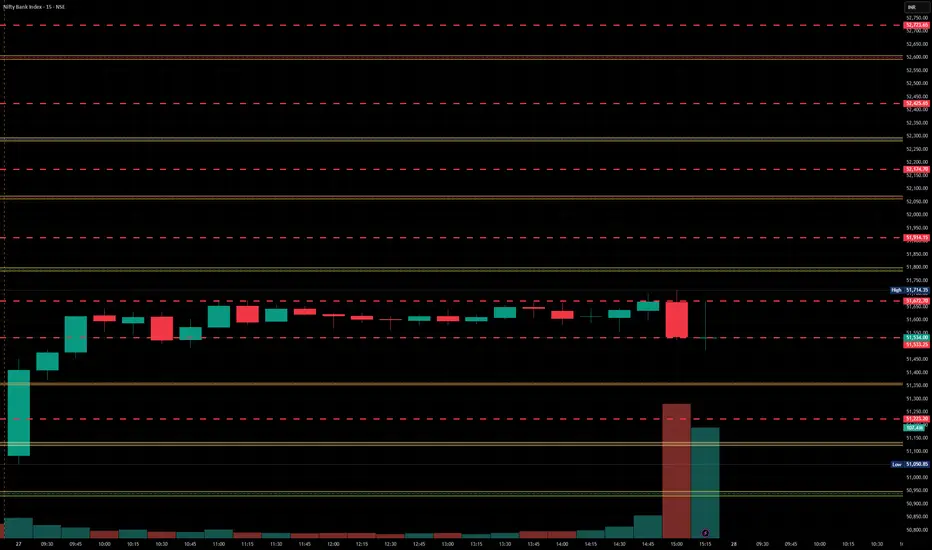
BankNifty levels - Mar 27, 2025Utilizing the support and resistance levels of BankNifty, along with the 5-minute timeframe candlesticks and VWAP, can enhance the precision of trade entries and exits on or near these levels. It is crucial to recognize that these levels are not static, and they undergo alterations as market dynamics evolve.
The dashed lines on the chart indicate the reaction levels, serving as additional points of significance. Furthermore, take note of the response at the levels of the High, Low, and Close values from the day prior.
We trust that this information proves valuable to you.
* If you found the idea appealing, kindly tap the Boost icon located below the chart. We encourage you to share your thoughts and comments regarding it.
Wishing you successful trading endeavors!

[INTRADAY] #BANKNIFTY PE & CE Levels(26/03/2025)Today will be slightly gap up opening expected in index. After opening if banknifty sustain above 51550 level then expected upside movement upto 51950+ level in opening session and this rally can extend for further 400-500+ points in case banknifty starts trading above 52050 level. Any major downside expected below 51450 level.

Bank Nifty - Triple Bottom in Bank Nifty - Daily Time FramTriple Bottom pattern spotted in Bank Nifty - in the daily time frame.
Can we reach the target by 31st?

BankNifty levels - Mar 26, 2025Utilizing the support and resistance levels of BankNifty, along with the 5-minute timeframe candlesticks and VWAP, can enhance the precision of trade entries and exits on or near these levels. It is crucial to recognize that these levels are not static, and they undergo alterations as market dynamics evolve.
The dashed lines on the chart indicate the reaction levels, serving as additional points of significance. Furthermore, take note of the response at the levels of the High, Low, and Close values from the day prior.
We trust that this information proves valuable to you.
* If you found the idea appealing, kindly tap the Boost icon located below the chart. We encourage you to share your thoughts and comments regarding it.
Wishing you successful trading endeavors!
