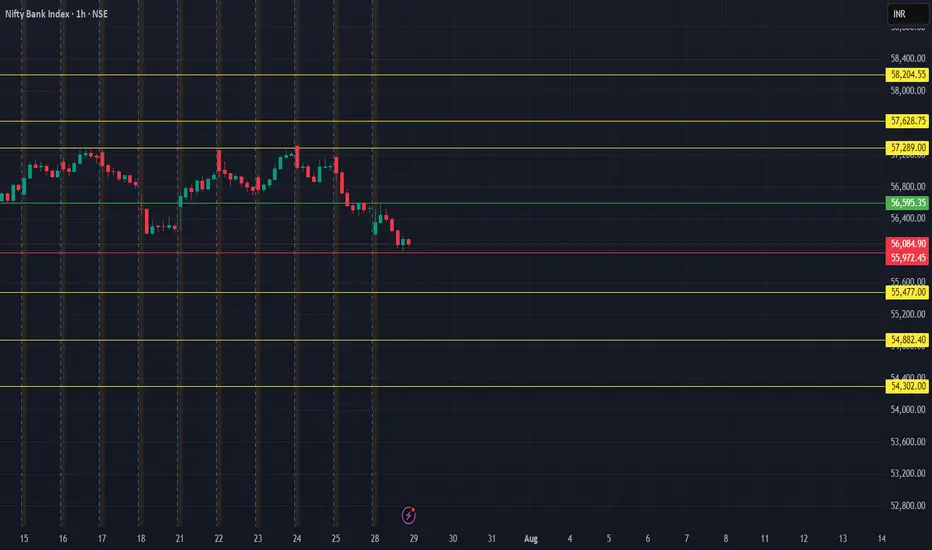
Bank Nifty view - August 2025Bank Nifty is trading around a crucial decision zone as we enter August 2025. The index is currently oscillating near significant technical levels that could dictate the next major directional move. Here’s a detailed outlook based on the latest key levels:
Bearish Scenario
Bank Nifty will turn distinctly bearish if it sustains below 56,040, especially if confirmed by persistent price action and volume. This breakdown could trigger accelerated selling and open up the following downside targets:
First Support Target - 55,475
If the index remains under 56,040, expect initial support around 55,475. This is the first area where some short covering or intraday bounce is possible. However, failure to hold here may invite further downside pressure.
Second Support Target - 54,885
A break below 55,475 paves the way towards the next meaningful support at 54,885. Watch for momentum and volume cues at this level; a lack of buying interest can result in a steeper fall.
Final Support Target - 54,302
Should the selling persist unabated, Bank Nifty could test the final support at 54,302. A close below this level could confirm a deeper corrective move, signaling increased bearish sentiment and potentially inviting broader market weakness.
Bullish Scenario
Bank Nifty would flip decisively bullish on a sustained move above 56,600. This breakout could attract fresh buying interest and propel the index toward the following upside targets:
First Resistance Target - 57,280
A breakout above 56,600 should see the index quickly challenging 57,280. Monitor price behaviour here for signs of continuation or profit booking.
Second Resistance Target - 57,630
Further strength above 57,280 could carry Bank Nifty to 57,630. This level represents short-term resistance and could see volatile swings.
Final Resistance Target - 58,205
Sustained bullish momentum may take the index to 58,205. Watch for signs of exhaustion or reversal as this is a critical resistance zone.
Risk Management:
Adopt a tight trailing stop-loss (TSL) to protect profits, as volatility can cause sharp pullbacks. Remain nimble and prepare to cover positions promptly.
This analysis is intended purely for educational purposes and should not be considered as financial advice.
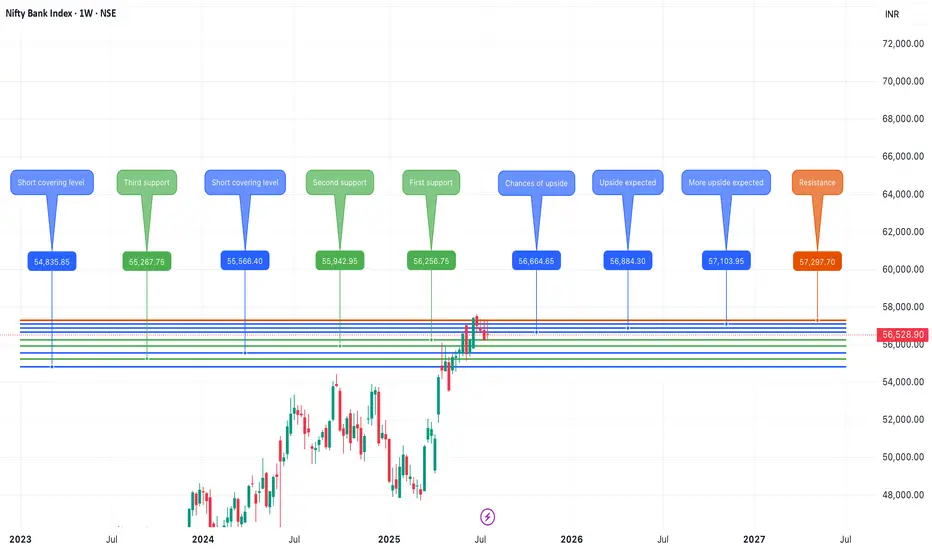
BANKNIFTY trade ideas
BANK NIFTY📈 Trade Setup Details
🔹 Trade Plan 1 (MTF-Based Entry)
Metric Value
Entry 56,223
Stop Loss 55,475
Risk 748 pts
Target 63,232
Reward 7,009 pts
Risk:Reward 1:9.4
🔸 Comment:
A high RR setup using the Daily DMIP zone. Ideal for trend continuation if price respects 55,780–56,223 range.
🔹 Trade Plan 2 (Deep Pullback Entry - ITF Zone)
Metric Value
Entry 54,054
Stop Loss 53,483
Risk 571 pts
Target 61,819
Reward 7,765 pts
Risk:Reward 1:13.6
🔸 Comment:
An aggressive RR trade if price retraces. Very favorable for swing traders anticipating bounce from deeper ITF demand zone.
🧭 Technical Landmarks
Key Level Value
Last High 55,467
Last Low 47,702
Point Range 7,765
🧠 Strategic Notes
Bias: Strong Bullish.
Preferred Entry: If price reacts bullishly at 56,223, can trigger first trade. If market dips, watch 54,054 for second trade.
Stop Loss Discipline: Clearly placed with low drawdown.
Trend Confirmation: All HTF zones are bullish, adding confidence to long entries.
🔍 Multi-Timeframe (MTF) Analysis Summary
Timeframe Trend Zone Type Proximal Distal Average
Yearly UP Rally-Base-Rally 54,467 44,429 49,448
Half-Yearly UP BUFL 54,467 49,654 52,061
Quarterly UP Rally-Base-Rally 54,467 49,156 51,812
HTF Avg. UP 54,467 47,746 51,107
| Monthly | UP | Rally-Base-Rally | 55,875 | 53,483 | 54,679 |
| Weekly | UP | Rally-Base-Rally | 56,328 | 55,381 | 55,855 |
| Daily | UP | DMIP (BUFL) | 56,223 | 55,780 | 56,002 |
| MTF Avg. | UP | | 56,142 | 54,881 | 55,512 |
| 240m | UP | DMIP | 55,942 | 55,475 | 55,709 |
| 180m | UP | DMIP | 55,597 | 55,475 | 55,536 |
| 60m | UP | DMIP | 55,597 | 55,475 | 55,536 |
| ITF Avg. | UP | | 55,712 | 55,475 | 55,594 |
✅ Conclusion: All timeframes are bullish, with higher highs and strong demand zones developing across MTF and ITF — indicating a clear uptrend continuation structure.
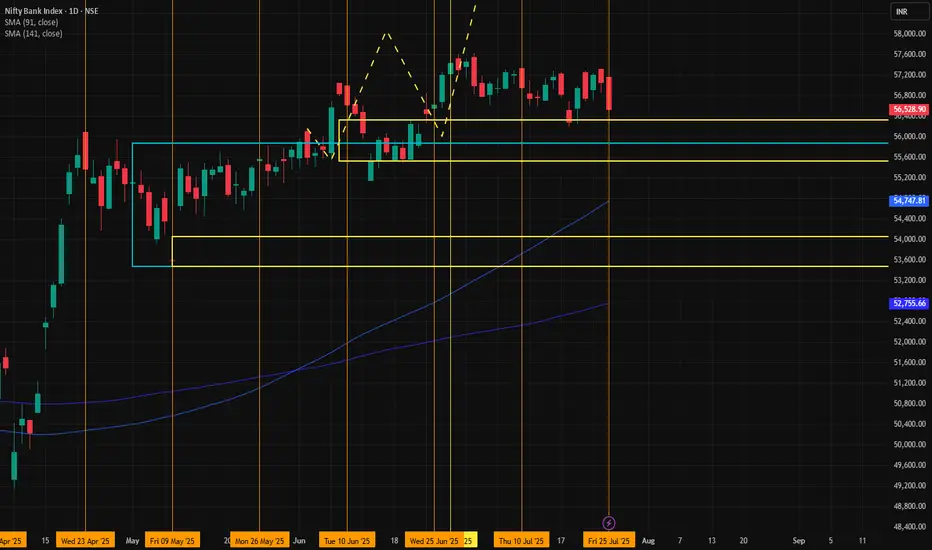
Banknifty July 5th Week AnalysisThe Bank Nifty is showing indecision, with the weekly close at 56,500 favoring bears over bulls. The key support zone lies between 56,250 and 55,900. If Bank Nifty breaches this range, further downside is expected toward the significant short-covering zone of 55,500–54,850. On the upside, Bank Nifty must cross and sustain above 56,650 to gain momentum, potentially reaching last week's highs of 57,200–57,300.
BANK NIFTY S/R for 28/7/25Support and Resistance Levels:
Support Levels: These are price points (green line/shade) where a downward trend may be halted due to a concentration of buying interest. Imagine them as a safety net where buyers step in, preventing further decline.
Resistance Levels: Conversely, resistance levels (red line/shade) are where upward trends might stall due to increased selling interest. They act like a ceiling where sellers come in to push prices down.
Breakouts:
Bullish Breakout: When the price moves above resistance, it often indicates strong buying interest and the potential for a continued uptrend. Traders may view this as a signal to buy or hold.
Bearish Breakout: When the price falls below support, it can signal strong selling interest and the potential for a continued downtrend. Traders might see this as a cue to sell or avoid buying.
MA Ribbon (EMA 20, EMA 50, EMA 100, EMA 200) :
Above EMA: If the stock price is above the EMA, it suggests a potential uptrend or bullish momentum.
Below EMA: If the stock price is below the EMA, it indicates a potential downtrend or bearish momentum.
Trendline: A trendline is a straight line drawn on a chart to represent the general direction of a data point set.
Uptrend Line: Drawn by connecting the lows in an upward trend. Indicates that the price is moving higher over time. Acts as a support level, where prices tend to bounce upward.
Downtrend Line: Drawn by connecting the highs in a downward trend. Indicates that the price is moving lower over time. It acts as a resistance level, where prices tend to drop.
Disclaimer:
I am not SEBI registered. The information provided here is for learning purposes only and should not be interpreted as financial advice. Consider the broader market context and consult with a qualified financial advisor before making investment decisions.

BankNifty levels - Jul 28, 2025Utilizing the support and resistance levels of BankNifty, along with the 5-minute timeframe candlesticks and VWAP, can enhance the precision of trade entries and exits on or near these levels. It is crucial to recognize that these levels are not static, and they undergo alterations as market dynamics evolve.
The dashed lines on the chart indicate the reaction levels, serving as additional points of significance. Furthermore, take note of the response at the levels of the High, Low, and Close values from the day prior.
We trust that this information proves valuable to you.
* If you found the idea appealing, kindly tap the Boost icon located below the chart. We encourage you to share your thoughts and comments regarding it.
Wishing you successful trading endeavors!

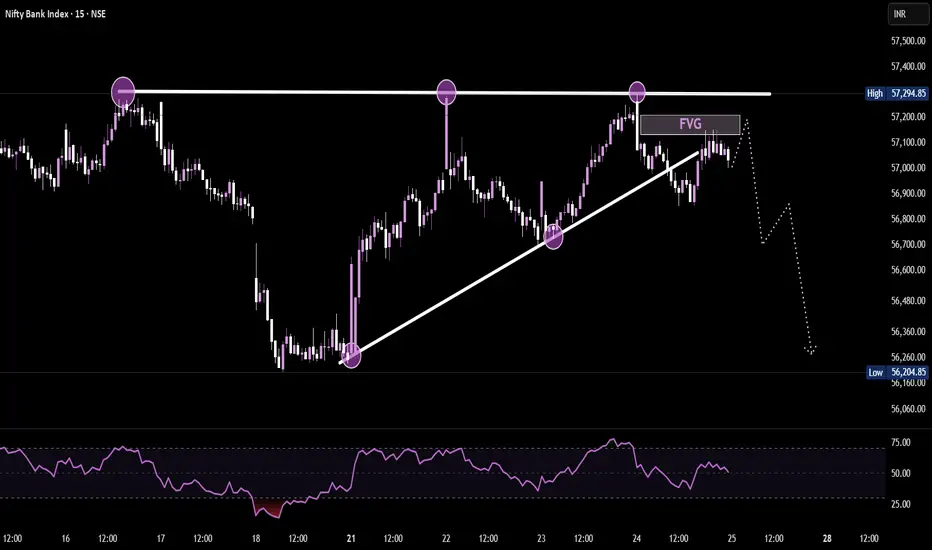
Nifty Bank-15MIN building up short-side liquidity Price tapped into a strong resistance zone multiple times, forming equal highs — a classic liquidity pool.
After a trendline break and formation of an FVG (Fair Value Gap), price is likely to retest the imbalance before continuing lower.
The setup hints at a potential liquidity sweep followed by a sharp selloff toward fresh lows.
[INTRADAY] #BANKNIFTY PE & CE Levels(25/07/2025)Bank Nifty is likely to start the session with a slight gap-down, hovering just below the 57,050–57,100 resistance zone. This zone has been acting as a critical barrier over the past sessions, and until it's breached, upside momentum may remain capped.
A strong bullish move can be anticipated above 57,050, where call option buying is favored. If Bank Nifty sustains this breakout, we can expect a continuation rally toward 57,250, 57,350, and 57,450+ levels. This would mark a short-term trend reversal and signal fresh bullish interest.
On the downside, weakness may resume if the index breaks below the 56,950 mark. A sustained move below this could trigger a quick correction targeting 56,750, 56,650, and 56,550- levels, offering good opportunities for put option buyers.

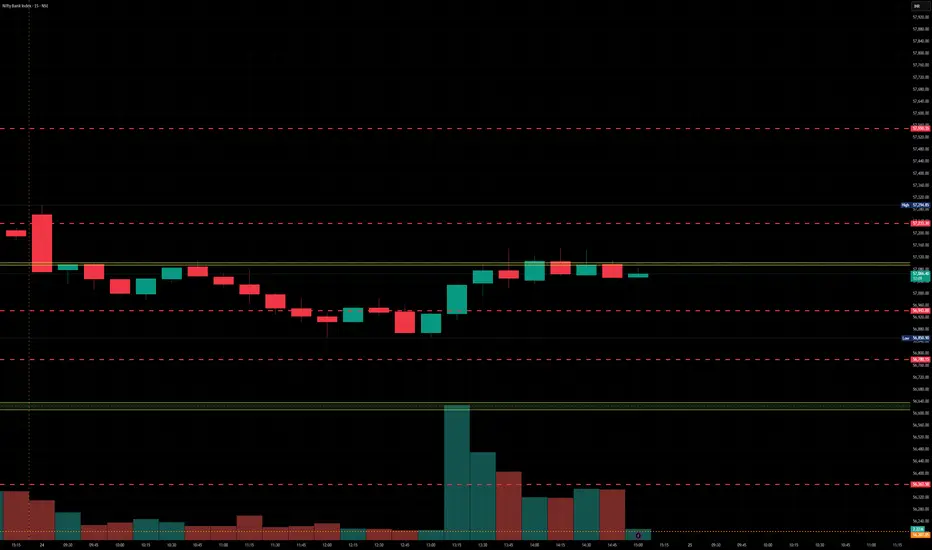
Banknifty levels - Jul 25, 2025Utilizing the support and resistance levels of BankNifty, along with the 5-minute timeframe candlesticks and VWAP, can enhance the precision of trade entries and exits on or near these levels. It is crucial to recognize that these levels are not static, and they undergo alterations as market dynamics evolve.
The dashed lines on the chart indicate the reaction levels, serving as additional points of significance. Furthermore, take note of the response at the levels of the High, Low, and Close values from the day prior.
We trust that this information proves valuable to you.
* If you found the idea appealing, kindly tap the Boost icon located below the chart. We encourage you to share your thoughts and comments regarding it.
Wishing you successful trading endeavors!
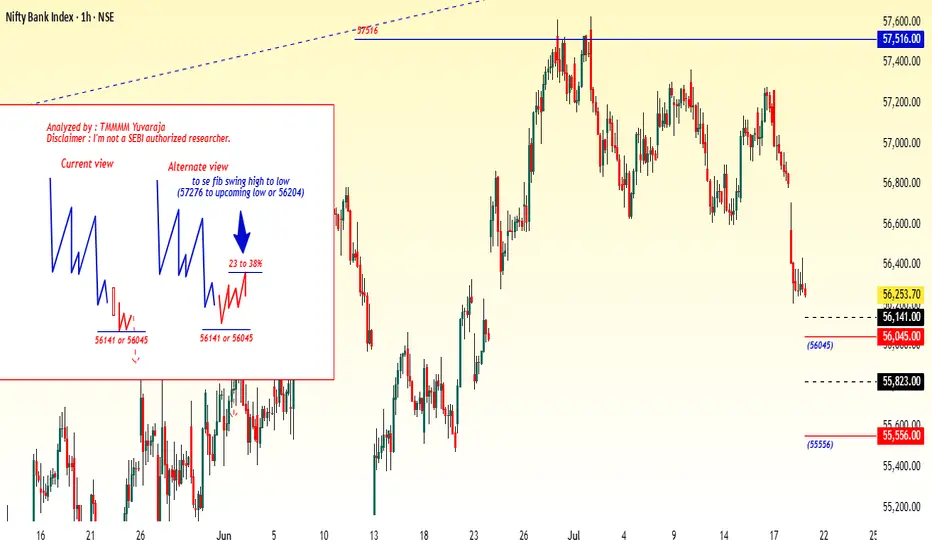
#Banknifty directions and levels for July 24Current View:
The current view suggests that, as mentioned above,
if the gap-up sustains, we can expect a rally continuation with some consolidation.
In this case, the parameters are showing slight strength,
so the rejection zone may act just around the minor resistance.
Alternate View:
The alternate view suggests that
if the gap-up does not sustain or if the market rejects near immediate resistance with a solid reversal,
then we can expect a minor correction of around 23% to 38%.
However, unless the market breaks below the 38% level,
we cannot confirm a reversal into a bearish trend.

[INTRADAY] #BANKNIFTY PE & CE Levels(24/07/2025)Bank Nifty is likely to open with a slight gap-up, continuing its recent upward trajectory. The index has shown strength by reclaiming key resistance zones and now trades above 57,100, indicating bullish sentiment in the market. Today’s price action will be crucial near immediate supply and resistance zones.
On the upside, if Bank Nifty sustains above 57,050–57,100, a continuation move may unfold toward 57,250, 57,350, and 57,450+ levels. A decisive breakout above 57,550 will open up further upside possibilities with targets near 57,750, 57,850, and 57,950+, where the next key resistance lies.
On the downside, weakness will only emerge if the index breaks below 56,950, which could trigger a sell-off with downside targets of 56,750, 56,650, and 56,550-. This zone also marks the base of the recent rally, and breaching it could suggest exhaustion of momentum.
Overall, the trend remains positive with momentum favoring the bulls as long as the index remains above 57,000. Traders are advised to wait for confirmation near the mentioned levels before initiating trades and maintain strict risk management with trailing stop-losses.

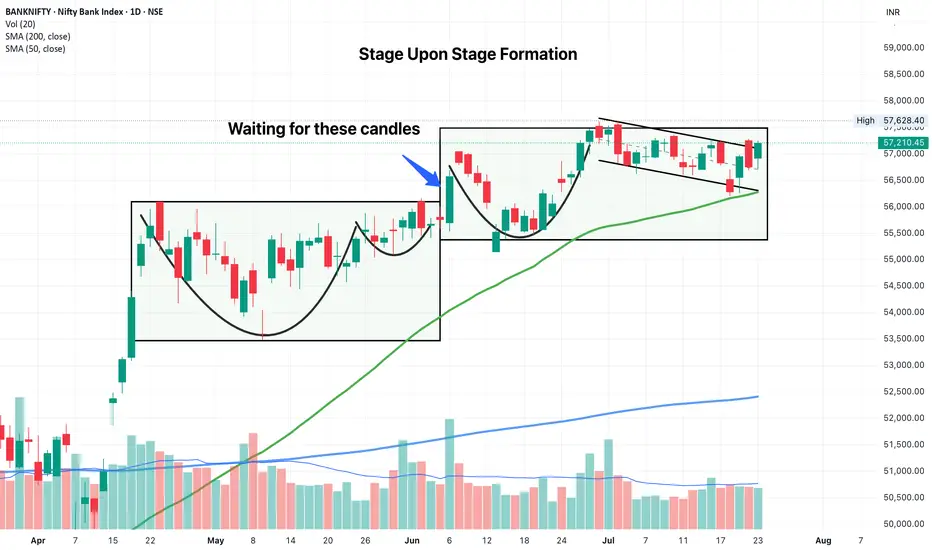
BankNifty Looks ready for a strong moveWe had an inside candle forming today. A small shakeout below today's low would be ideal, but we might move up in a straight line tomorrow if opening is strong.
You can play this with options if you like. But do buying and not selling. Max loss should be capped at 1% of your portfolio and reward should be taken at 2-3x the risk
BankNifty levels - Jul 24, 2025Utilizing the support and resistance levels of BankNifty, along with the 5-minute timeframe candlesticks and VWAP, can enhance the precision of trade entries and exits on or near these levels. It is crucial to recognize that these levels are not static, and they undergo alterations as market dynamics evolve.
The dashed lines on the chart indicate the reaction levels, serving as additional points of significance. Furthermore, take note of the response at the levels of the High, Low, and Close values from the day prior.
We trust that this information proves valuable to you.
* If you found the idea appealing, kindly tap the Boost icon located below the chart. We encourage you to share your thoughts and comments regarding it.
Wishing you successful trading endeavors!

[INTRADAY] #BANKNIFTY PE & CE Levels(23/07/2025)Bank Nifty is likely to open with a gap-up today, continuing its recent volatility and range-bound behavior. There are no major changes from yesterday’s levels, and the index remains in a crucial zone near short-term resistance and support bands. A breakout or breakdown from this zone could decide the next directional move.
Upside continuation may resume if Bank Nifty breaks above 57,050, which can trigger a momentum rally toward 57,250, 57,350, and possibly 57,450+. Traders can consider long positions in this case once confirmation and volume support the breakout.
On the downside, if the index trades and sustains below 56,950, further weakness may be seen. A bearish move below 56,950 can lead to a drop toward 56,750, 56,650, and 56,550-. This level becomes important support, and a breach could invite selling pressure.
Additionally, if Bank Nifty takes support near the 56,550–56,600 zone again, reversal buying can be considered. A bounce from this area could offer targets of 56,750, 56,850, and 56,950+.

#BankNifty directions and levels for July 23rd:Looking at the chart, the current view suggests:
* If the market sustains the gap-up and breaks the immediate resistance, we can expect the pullback to continue with a moderately bullish tone.
Alternate view:
* If the gap-up doesn’t sustain and the market declines initially, it may reach the immediate support level.
* If a pullback happens from there, we can expect a range-bound market.
* Conversely, if the support breaks, the correction is likely to continue.

BankNifty levels - Jul 23, 2025Utilizing the support and resistance levels of BankNifty, along with the 5-minute timeframe candlesticks and VWAP, can enhance the precision of trade entries and exits on or near these levels. It is crucial to recognize that these levels are not static, and they undergo alterations as market dynamics evolve.
The dashed lines on the chart indicate the reaction levels, serving as additional points of significance. Furthermore, take note of the response at the levels of the High, Low, and Close values from the day prior.
We trust that this information proves valuable to you.
* If you found the idea appealing, kindly tap the Boost icon located below the chart. We encourage you to share your thoughts and comments regarding it.
Wishing you successful trading endeavors!

#Banknifty directions and levels for July 22nd:In the previous session, both Nifty and Bank Nifty experienced a pullback and managed to sustain it. However, structurally, the trend remains bearish in the lower time frame. So, how should we interpret this sentiment?
1, Since there’s no clear direction, if the market faces rejection initially, we can expect minor consolidation within the 38% Fibonacci range.
2, On the other hand, if it sustains the gap-up and breaks the immediate resistance with a solid structure, we can follow the direction for further upside.

[INTRADAY] #BANKNIFTY PE & CE Levels(22/07/2025)Bank Nifty is expected to open gap-up today, continuing the momentum seen in yesterday’s session. The index has successfully crossed above the short-term resistance zone near 56,900, showing bullish strength. The next key breakout level is at 57,050, and once crossed decisively, we may see a sharp upward rally.
Traders can look to Buy CE option above 57,050, targeting 57,250, 57,350, and 57,450+. The structure indicates that momentum buyers may take over above this zone, with the potential for strong upside if Bank Nifty sustains above the breakout level.
On the downside, if the index slips back and breaks 56,950 decisively, then Buy PE option below 56,950 can be considered, with potential downside targets of 56,750, 56,650, and 56,550-. This zone will act as an immediate intraday support and any fall below it can lead to quick profit-booking.
Additionally, if Bank Nifty finds support near the 56,550–56,600 zone again, traders may also consider reversal CE buying with upside targets of 56,750, 56,850, and 56,950+.

BankNifty levels - Jul 22, 2025Utilizing the support and resistance levels of BankNifty, along with the 5-minute timeframe candlesticks and VWAP, can enhance the precision of trade entries and exits on or near these levels. It is crucial to recognize that these levels are not static, and they undergo alterations as market dynamics evolve.
The dashed lines on the chart indicate the reaction levels, serving as additional points of significance. Furthermore, take note of the response at the levels of the High, Low, and Close values from the day prior.
We trust that this information proves valuable to you.
* If you found the idea appealing, kindly tap the Boost icon located below the chart. We encourage you to share your thoughts and comments regarding it.
Wishing you successful trading endeavors!

#Banknifty directions and levels for July 21st:What can we expect today?
In the previous session, both Nifty and Bank Nifty fell sharply. Structurally, the trend remains negative.
However, due to major firms' results, we might see some volatility in the first half, possibly leading to initial speculation.
That said, as per the structure my expectation is a continuation of the correction that's my current view
The alternate view is If the market takes an initial pullback, we could see a 23–38% retracement in the minor swing. Even in this scenario, the bias remains bearish unless the 38% Fibonacci level is broken.
A break above 38% could extend the pullback toward the 50–78% levels.
[INTRADAY] #BANKNIFTY PE & CE Levels(21/07/2025)Bank Nifty is expected to open with a gap-up, indicating early bullish sentiment. However, price action near the 56,450–56,500 zone will be crucial in deciding the day’s direction. If Bank Nifty manages to sustain above the 56,650 level after opening, it may invite fresh momentum on the upside. A move above this zone can be seen as a strength confirmation, potentially pushing the index toward targets of 56,750, 56,850, and even 56,950+ levels.
On the other hand, if the index faces resistance and shows rejection from the 56,450–56,400 supply zone, weakness can creep in. This could trigger a corrective move toward the lower levels of 56,250, 56,150, and 56,050-, making it a favorable short trade setup for the day if confirmed by price action.
Additionally, a breakdown below the 55,950 support level can lead to strong bearish pressure. If this level is breached and sustained, the index may fall sharply toward the support zones of 55,750, 55,650, and 55,550-, indicating bearish continuation.

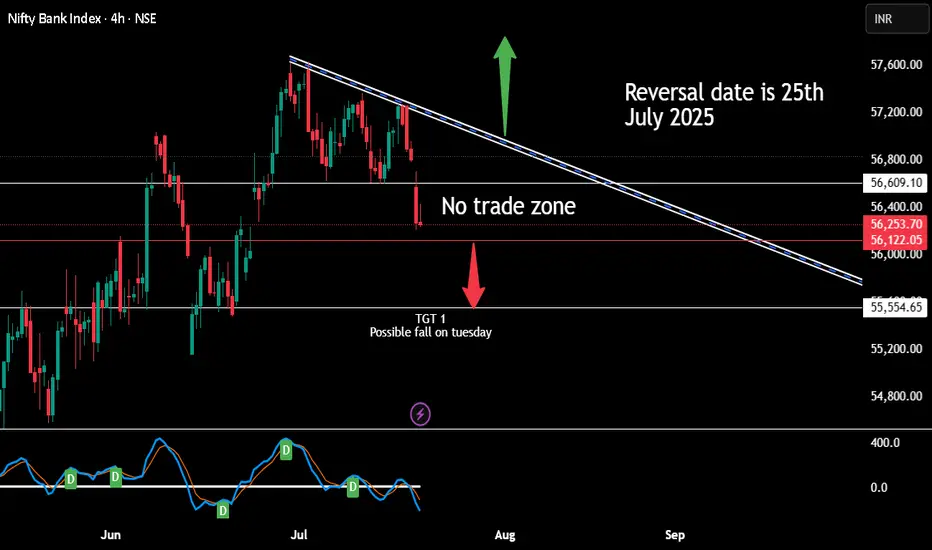
For next three days positional trading Once indicated level on red is broken and candle is closed even in 5 mins time frame then next candle execute the order. The only condition is the market has to halt before break out and consolidate for some time.
Sell future with 20-50 point stop loss for tgt of 55555
This trade is applicable only till 25th july 2025 there after we need to be watchful for reversal
Banknifty July 3rd Week AnalysisBanknifty is looking uncertain but we can expect short covering in later half of th week if it retraces upto 55400-600 , Imp support levels on downside are placed between 55900-56100 and below that we can expect levels upto 55700-400.On the upside imp level to watch 56550 and if banknifty crosses and sustains above 56550 then we can expect further upside upto 56900-57100.
ALL LEVELS ARE MARKED IN THE CHART POSTED.
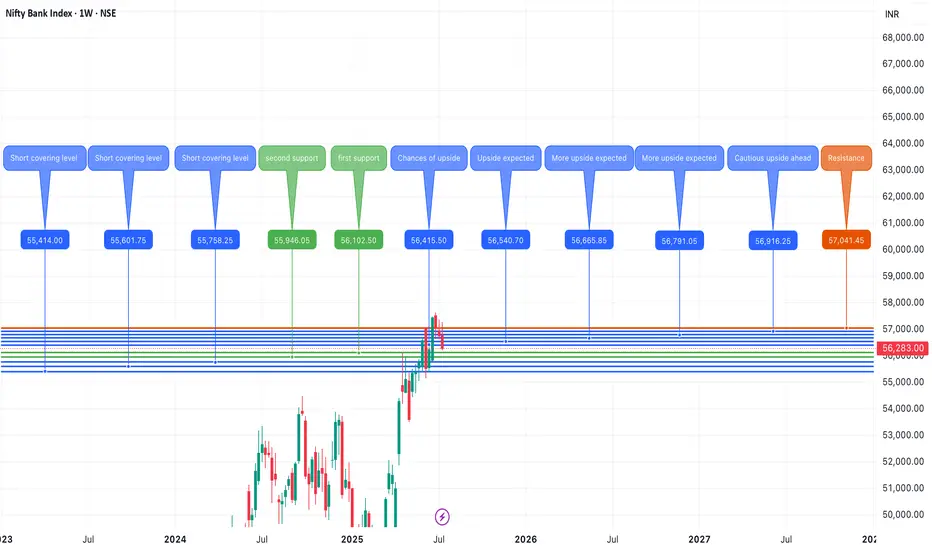
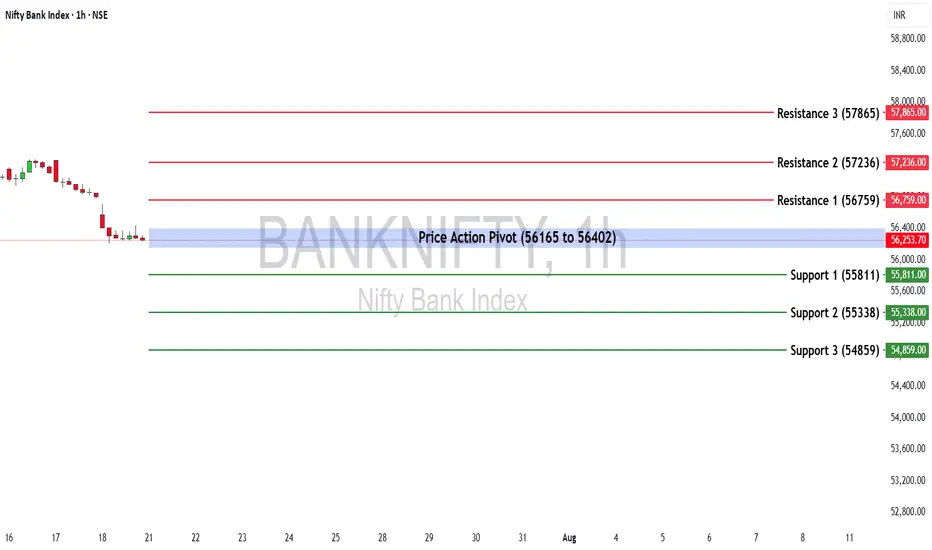
Bank Nifty Weekly Insights: Key Levels & TrendsBank Nifty ended the week at 56,283.00, registering a marginal decline of -0.83%.
🔹 Key Levels for the Upcoming Week
📌 Price Action Pivot Zone:
The critical zone to monitor for potential trend reversals or continuation lies between 56,165 and 56,402.
🔻 Support Levels:
Support 1 (S1): 55,811
Support 2 (S2): 55,338
Support 3 (S3): 54,859
🔺 Resistance Levels:
Resistance 1 (R1): 56,759
Resistance 2 (R2): 57,236
Resistance 3 (R3): 57,865
📈 Market Outlook
✅ Bullish Scenario:
If Bank Nifty sustains above the pivot zone (56,402), it may trigger renewed buying interest, potentially pushing the index toward R1 (56,759) and higher levels like R2 (57,236) and R3 (57,865).
❌ Bearish Scenario:
A breakdown below the lower end of the pivot zone at 56,165 may attract selling pressure, dragging the index towards S1 (55,811) and possibly lower levels like S2 (55,338) and S3 (54,859).
Disclaimer: lnkd.in