Bank Nifty | Pre Market Weekly View | 09 Dec - 13 Dec 2024Bank Nifty closed the previous week with a strong Bullish candle which has closed comfortably above the 50% zone of the previous fall.
For the next week, I have a strong feeling that BN could be range bound to mildly Bullish.
The overall trend is certainly Bullish. However, since there has been a strong rally last week, there could be some profit booking.
Again, a buy on dip strategy can be applied here.
Upside resistance zone is 54,200.
So, if there's a big gap up, look for short side reversal.
If there's a gap down, look for price action and buy.
BANKNIFTY trade ideas

Bank Nifty December 2024Bank nifty now all most recovery your down trend may be bullish next week plz use stop loss and properly,
support zone to market reverse u can trade only bullish trend for support line
follow the trend,
bank nifty 200EMA all ready cross may be try for reverse for 200ema line then trend move for bullish

Banknifty December 1st Week Analysis The BankNifty index is currently exhibiting positive trends on the charts. A crucial level for the upside trajectory is 52400. If BankNifty successfully crosses and maintains its position above 52400 then expect an upward movement towards 53100 or higher. Conversely, if it fails to sustain above 52400, then expect range-bound movement.And if BankNifty breach 51500 on the downside, then downward movement towards 51000-50700 is possible.

nifty & bank nifty prediction this video is a only for educational purpose
nifty & bank nifty levels .

BankNifty Rockets: 1800+ Points Secured with Precision!BANKNIFTY on the 15-minute timeframe demonstrated a powerful bullish trend, delivering a substantial profit of 1800+ points. This long trade setup was flawlessly executed using the Risological Swing Trading Indicator , which accurately identified the entry point, targets, and stop-loss levels.
BankNifty Key Levels:
TP1: 52198.70 ✅
TP2: 52510.65 ✅
TP3: 52822.60 ✅
TP4: 53015.35 ✅
BankNiftyTechnical Analysis:
The trade was initiated at an entry level of 52005.90, with a well-placed stop-loss at 51849.95 to manage risk effectively.
The price action confirmed a strong upward momentum, crossing over the Risological trend line, which signaled a clear long entry.
All targets were achieved in quick succession, reflecting the precision and reliability of the Risological system.
This trade stands out as a prime example of capturing massive intraday moves with high accuracy.
NAMASTE!

BANKNIFTYHi guys,
In this chart i Found a Demand Zone in BANKNIFTY CHART for Positional entry,
Observed these Levels based on price action and Demand & Supply.
*Don't Take any trades based on this Picture.
... because this chart is for educational purpose only not for Buy or Sell Recommendation..
Thank you

[INTRADAY] #BANKNIFTY PE & CE Levels(06/12/2024)Slightly gap up opening expected in banknifty. After opening expected it will continue the bullish rally towards the 53950+ level and this rally can extend for further 400-500 points in case banknifty starts trading and sustain above 54050 level. Downside 53550 will act as a support for today's session. Any major downside only expected below this support zone.

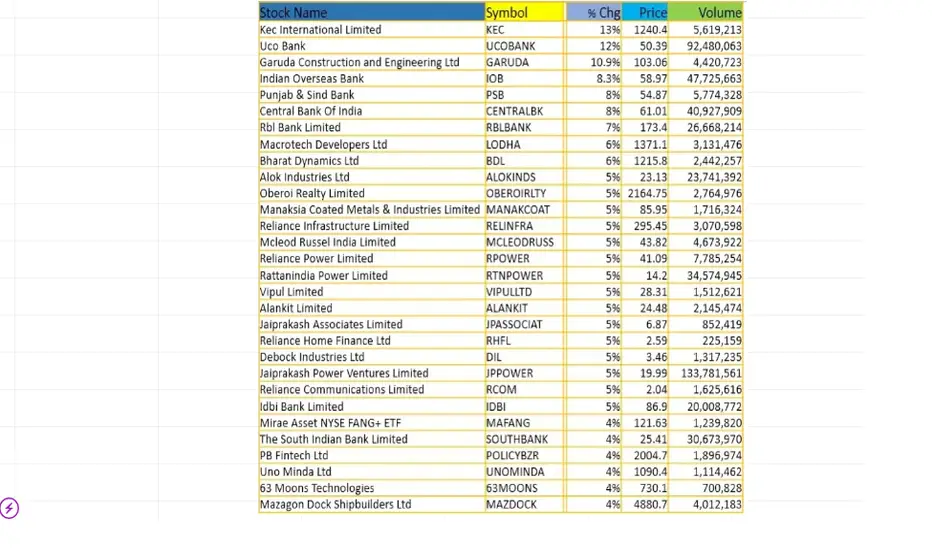
Intraday top stocks for trading (06/Dec/2024)Technical Analysis of Moving average stocks (06/Dec/2024)
follow for more updates and information

Banknifty technical analysis for tomorrow (06/Dec/2024)Bank Nifty moments for option and future trading 06/Dec/2024
follow us for more updates information.
message us for any stocks related information

BANKNIFTY : Trading Plan for 06-Dec-2024Trading Plan for Bank Nifty – 06-Dec-2024
Intro to the Previous Day's Chart Pattern:
On 05-Dec-2024, Bank Nifty displayed a remarkable journey, testing critical levels and forming significant zones.
Profit Booking Zone (₹54,472–₹54,787): Wave C extended zone acted as a stiff resistance.
No-Trade Zone (₹53,396–₹53,702): Represented indecision near Wave C completion, where the trend remained unclear ( Yellow Trend ).
Opening Support Zone (₹53,067): Held well to initiate bullish recoveries ( Green Trend ).
Deep Retracement Zone (₹52,400–₹52,600): Marked by Fibonacci levels (113%-127%), offering a strong demand area ( Green Trend ).
The day concluded with a consolidation between critical zones, setting the stage for decisive moves on 06-Dec-2024.
Trading Plan for 06-Dec-2024
Gap Up Opening (+200 Points):
If Bank Nifty opens near or above ₹54,000 , expect resistance at the Profit Booking Zone (₹54,472–₹54,787) .
Action Plan:
Watch for rejection or bearish patterns near ₹54,472 . Short positions can be initiated with targets of ₹54,000 and ₹53,702 .
Sustained breakout above ₹54,787 with strong volumes signals continuation of the bullish rally. Long trades can target ₹55,200 and ₹55,450 .
Risk Management Tip:
Use tight stop-loss for short trades above ₹54,787 . In options, consider selling OTM calls above ₹55,000 for time decay advantages.
Flat Opening (Near ₹53,600):
A flat opening near the No-Trade Zone (₹53,396–₹53,702) demands caution.
Action Plan:
If Bank Nifty sustains above ₹53,702 , initiate long positions targeting ₹54,472 .
Below ₹53,396 , expect a dip toward the Opening Support Zone (₹53,067) . Look for buying opportunities with bullish signals at this level.
Risk Management Tip:
Avoid aggressive trades in the No-Trade Zone. Wait for a clear breakout or breakdown before entering trades. For options, use spreads like bull call spreads to minimize risks.
Gap Down Opening (-200 Points):
A gap-down opening near ₹53,067 or below will test critical supports.
Action Plan:
If Bank Nifty stabilizes above ₹53,067 , expect a recovery toward ₹53,396 . Long trades can be initiated with proper risk-reward setups.
Failure to hold ₹53,067 opens the door to the Deep Retracement Zone (₹52,400–₹52,600) , where buying opportunities may arise for targets of ₹53,067 and ₹53,396 .
Risk Management Tip:
For high volatility scenarios, trade lighter positions. Use option strategies like straddles or strangles to capitalize on premium spikes.
Summary and Conclusion:
Resistance Levels: ₹54,472, ₹54,787
Support Levels: ₹53,702, ₹53,067, ₹52,400
Key Levels to Watch: Rejection at ₹54,472 or breakdown below ₹53,067 will determine intraday momentum.
Follow the trends: Yellow (Sideways), Green (Bullish), Red (Bearish) .
Tips for Options Trading:
Use proper hedging strategies like spreads to limit losses.
Avoid over-leveraging in volatile conditions.
Disclaimer:
The above analysis is for educational purposes only . I am not a SEBI-registered analyst. Please perform your research or consult a financial advisor before trading. Market risks are significant; trade responsibly.

BANK NIFTY S/R for 6/12/24Support and Resistance Levels:
Support Levels: These are price points (green line/shade) where a downward trend may be halted due to a concentration of buying interest. Imagine them as a safety net where buyers step in, preventing further decline.
Resistance Levels: Conversely, resistance levels (red line/shade) are where upward trends might stall due to increased selling interest. They act like a ceiling where sellers come in to push prices down.
Breakouts:
Bullish Breakout: When the price moves above resistance, it often indicates strong buying interest and the potential for a continued uptrend. Traders may view this as a signal to buy or hold.
Bearish Breakout: When the price falls below support, it can signal strong selling interest and the potential for a continued downtrend. Traders might see this as a cue to sell or avoid buying.
MA Ribbon (EMA 20, EMA 50, EMA 100, EMA 200) :
Above EMA: If the stock price is above the EMA, it suggests a potential uptrend or bullish momentum.
Below EMA: If the stock price is below the EMA, it indicates a potential downtrend or bearish momentum.
Trendline: A trendline is a straight line drawn on a chart to represent the general direction of a data point set.
Uptrend Line: Drawn by connecting the lows in an upward trend. Indicates that the price is moving higher over time. Acts as a support level, where prices tend to bounce upward.
Downtrend Line: Drawn by connecting the highs in a downward trend. Indicates that the price is moving lower over time. It acts as a resistance level, where prices tend to drop.
Disclaimer:
I am not a SEBI registered. The information provided here is for learning purposes only and should not be interpreted as financial advice. Consider the broader market context and consult with a qualified financial advisor before making investment decisions.

Bn loss recovery tradeBn 53000 pe
entry 745
exit 778
sl 709
Target hit
reason for the trade price action with high volume brake down and support and trendline brake
trade closing reason the region is buying zone
as per rule 2 trades per day
done for the day
happy trading,,,,,

[INTRADAY] #BANKNIFTY PE & CE Levels(05/12/2024)Today will be slightly gap up opening expected in banknifty after opening possible banknifty will continue it's bullish rally towards the 53450 level. This rally can be extended for further 400-500+ points in case banknifty gives breakout and starts trading above 53550 level. Downside 53050 level will act as a support zone for index. Any major downside only expected below 52950 level.

BankNifty Intraday Support & Resistance Levels for 05.12.2024On Wednesday, BankNifty opened with a positive bias, hitting a low of 52685.15 before rallying to a high of 53387.10, breaking above the Daily supply zone. It closed at 53266.90, gaining 571 points from the previous close. The Weekly Trend (50 SMA) remains sideways, while the Daily Trend (50 SMA) has turned positive, suggesting an upward momentum.
Demand/Support Zones
Near Demand/Support Zone (15m): 53011.45 - 53128.65
Near Demand/Support Zone (75m): 52563.20 - 52780.90
Far Demand/Support Zone (30m): 52045.55 - 52194.65
Far Demand/Support Zone (30m): 51040.05 - 51271.50
Far Demand/Support Zone (Daily): 49787.10 - 50983.50
Supply/Resistance Zones
Near Supply/Resistance Zone (Weekly): 53741.40 - 54467.35

Intraday moving average stocks for (05/Dec/2024)Technical Analysis of Moving average stocks (05/Dec/2024)
follow for more updates and information
Banknifty technical analysis for tomorrow (05/Dec/2024)Nifty moments for option and future trading 05/Dec/2024
follow us for more updates information.
message us for any stocks related information

BANKNIFTY : Trading levels and Plan for 05-Dec-2024Trading Plan for Bank Nifty – 05-Dec-2024
Intro: Previous Day's Chart Pattern
On 04-Dec-2024, after mitigating the supply zone at deep retracement zone from the last swing high, showed initial resistance near important resistance zone. by mitigating supplies Banknifty is forming a strong support zone near ₹53,051. The index respected the deep retracement zone and closed near ₹53,236, indicating the potential for bullish continuation. The Yellow trend suggests consolidation, the Green trend indicates a bullish trajectory, and the Red trend points to bearish movements.
Plan for Different Opening Scenarios:
1. Gap-Up Opening (Above ₹53,465 by 200+ points)
If Bank Nifty opens significantly higher, crossing ₹53,702:
Immediate Resistance: Watch for ₹54,472, which acts as the final intraday resistance. Prices sustaining above this level could lead to a breakout towards ₹54,600 or higher in coming sessions.
Action Plan: Allow prices to settle for the first 15–30 minutes. Look for pullbacks near ₹53,702 for entry opportunities, with a stop loss placed below ₹53,465. Target the next resistance zones at ₹54,472 and ₹54,600.
Risk Management: If prices fail to sustain above ₹53,702 and show strong selling pressure, avoid initiating long positions. Reassess the trend near ₹53,394.
2. Flat Opening (Within ₹53,051 to ₹53,394)
If Bank Nifty opens flat, between yesterday’s closing range:
Key Support and Resistance: ₹53,051 will act as strong support, while ₹53,394 is the immediate resistance.
Action Plan: Wait for a breakout from this range.
If prices sustain above ₹53,394, initiate long positions for targets of ₹53,702 and ₹54,472. Place the stop loss below ₹53,236.
If prices break below ₹53,051, consider short positions targeting ₹52,893 and ₹52,533. Stop loss above ₹53,236.
Risk Management: Avoid overleveraging as the consolidation phase might lead to false breakouts. Confirm the trend before entering trades.
3. Gap-Down Opening (Below ₹52,893 by 200+ points)
If Bank Nifty opens below key support levels:
Critical Levels: ₹52,533 becomes a significant support zone. Failing this zone can trigger further selling pressure towards ₹52,200.
Action Plan:
Observe the opening 15–30 minutes for price stability.
If prices rebound from ₹52,533, look for buying opportunities targeting ₹52,893 and ₹53,051. Place a stop loss below ₹52,400.
If prices sustain below ₹52,533, initiate shorts for targets of ₹52,200 and ₹51,900. Stop loss above ₹52,893.
Risk Management: Protect capital by reducing position size in high volatility conditions. Prioritize defined stop-loss levels to minimize losses.
Tips for Risk Management in Options Trading:
Position Sizing: Trade with a smaller position size in volatile conditions to avoid large losses.
Premium Decay Awareness: Avoid holding options positions close to expiry unless they are deeply in-the-money.
Avoid Averaging Down: Do not add to losing positions, especially in options, as losses can multiply quickly.
Hedge Positions: Consider strategies like spreads or buying protective puts to reduce risk exposure.
Summary and Conclusion:
Bank Nifty’s price action on 04-Dec-2024 hints at a bullish structure, with strong support near ₹53,051 and resistance levels clearly defined. For 05-Dec-2024, focus on identifying the trend post-opening and trade cautiously, especially in gap-up or gap-down scenarios. Use stop losses diligently and prioritize risk management to navigate the intraday volatility.
Disclaimer:
I am not a SEBI-registered analyst. This analysis is for educational purposes only and should not be considered investment advice. Please consult your financial advisor before making any trading decisions.

BANK NIFTY S/R for 5/12/24Support and Resistance Levels:
Support Levels: These are price points (green line/shade) where a downward trend may be halted due to a concentration of buying interest. Imagine them as a safety net where buyers step in, preventing further decline.
Resistance Levels: Conversely, resistance levels (red line/shade) are where upward trends might stall due to increased selling interest. They act like a ceiling where sellers come in to push prices down.
Breakouts:
Bullish Breakout: When the price moves above resistance, it often indicates strong buying interest and the potential for a continued uptrend. Traders may view this as a signal to buy or hold.
Bearish Breakout: When the price falls below support, it can signal strong selling interest and the potential for a continued downtrend. Traders might see this as a cue to sell or avoid buying.
MA Ribbon (EMA 20, EMA 50, EMA 100, EMA 200) :
Above EMA: If the stock price is above the EMA, it suggests a potential uptrend or bullish momentum.
Below EMA: If the stock price is below the EMA, it indicates a potential downtrend or bearish momentum.
Trendline: A trendline is a straight line drawn on a chart to represent the general direction of a data point set.
Uptrend Line: Drawn by connecting the lows in an upward trend. Indicates that the price is moving higher over time. Acts as a support level, where prices tend to bounce upward.
Downtrend Line: Drawn by connecting the highs in a downward trend. Indicates that the price is moving lower over time. It acts as a resistance level, where prices tend to drop.
Disclaimer:
I am not a SEBI registered. The information provided here is for learning purposes only and should not be interpreted as financial advice. Consider the broader market context and consult with a qualified financial advisor before making investment decisions.

BankNifty levels for 4 Dec 2024BankNifty is in uptrend....
Two levels for buying ...
53160 and 52885.
On intraday purpose BankNifty is bearish below 52885.
!! Radha Radha !!

banknifty expiry monthly hedge Bn 51700 & 52700 ce pe 636 578
total premium 1214
sl 150 pts tgt 360
R;R 1:2
trail at 1:1
note yesterdays trade set up

[INTRADAY] #BANKNIFTY PE & CE Levels(04/12/2024)Today will be gap up opening expected in banknifty. Expected opening near 53000 level. After opening if banknifty starts trading and sustain above 53050 level then possible strong upside rally of 400-500+ points in index. Downside 52550 level will act as a strong support for today's session. Any major downside only expected below the 52450 level.

BankNifty Intraday Support & Resistance Levels for 04.12.2024On Tuesday, BankNifty opened gap-up, hit a low of 52216.85, and rallied to a day high of 52780.90, testing the 15m supply zone. It closed at 52695.75, gaining 586 points over the previous close. Both the Weekly Trend (50 SMA) and Daily Trend (50 SMA) remain sideways, signaling a neutral bias.
Demand/Support Zones
Near Demand/Support Zone (30m): 52045.55 - 52194.65
Far Demand/Support Zone (30m): 51040.05 - 51271.50
Far small Demand/Support Zone (15m): 50609.75 - 50824.55
Far Support: 49282.65 (61.8% FIBO Level)
Far Demand/Support Zone (Daily): 44633.85 - 45750.40
Supply/Resistance Zones
Near Supply/Resistance Zone (Daily): 52817.80 - 53235.25
Far Supply/Resistance Zone (Weekly): 53741.40 - 54467.35

BANKNIFTY Trade Setup for Wednesday (04-Wed-2024)Key Notes:
Bank nifty swept previous day Buy Side Liquidity (BSL) indicating probable downfall,
Price is under higher time frame (H4) Institutional reference levels
Institutional references identified
Bearish Order Block
Bearish Mitigation Block
Buy Side Liquidity (BSL)
Bank Nifty Futures OI data indicating strong bullish bias
Most Likely Bank nifty is going to give a strong breakout from institutional reference levels
Morning Session price may open with strong gap up.
If gap up is strong enough to break all the key levels, Entire day bullish view
If gap up is held strongly by bearish order block, then price is going to take a sharp downfall.
Those who carried shorts for delivery yesterday going to experience some pain today.
