BANK NIFTY S/R for 4/12/24Support and Resistance Levels:
Support Levels: These are price points (green line/shade) where a downward trend may be halted due to a concentration of buying interest. Imagine them as a safety net where buyers step in, preventing further decline.
Resistance Levels: Conversely, resistance levels (red line/shade) are where upward trends might stall due to increased selling interest. They act like a ceiling where sellers come in to push prices down.
Breakouts:
Bullish Breakout: When the price moves above resistance, it often indicates strong buying interest and the potential for a continued uptrend. Traders may view this as a signal to buy or hold.
Bearish Breakout: When the price falls below support, it can signal strong selling interest and the potential for a continued downtrend. Traders might see this as a cue to sell or avoid buying.
MA Ribbon (EMA 20, EMA 50, EMA 100, EMA 200) :
Above EMA: If the stock price is above the EMA, it suggests a potential uptrend or bullish momentum.
Below EMA: If the stock price is below the EMA, it indicates a potential downtrend or bearish momentum.
Trendline: A trendline is a straight line drawn on a chart to represent the general direction of a data point set.
Uptrend Line: Drawn by connecting the lows in an upward trend. Indicates that the price is moving higher over time. Acts as a support level, where prices tend to bounce upward.
Downtrend Line: Drawn by connecting the highs in a downward trend. Indicates that the price is moving lower over time. It acts as a resistance level, where prices tend to drop.
Disclaimer:
I am not a SEBI registered. The information provided here is for learning purposes only and should not be interpreted as financial advice. Consider the broader market context and consult with a qualified financial advisor before making investment decisions.
BANKNIFTY trade ideas

BANKNIFTY : Trading levels and Plan for 04-Dec-2024Bank Nifty Trading Plan for 04-Dec-2024 📈
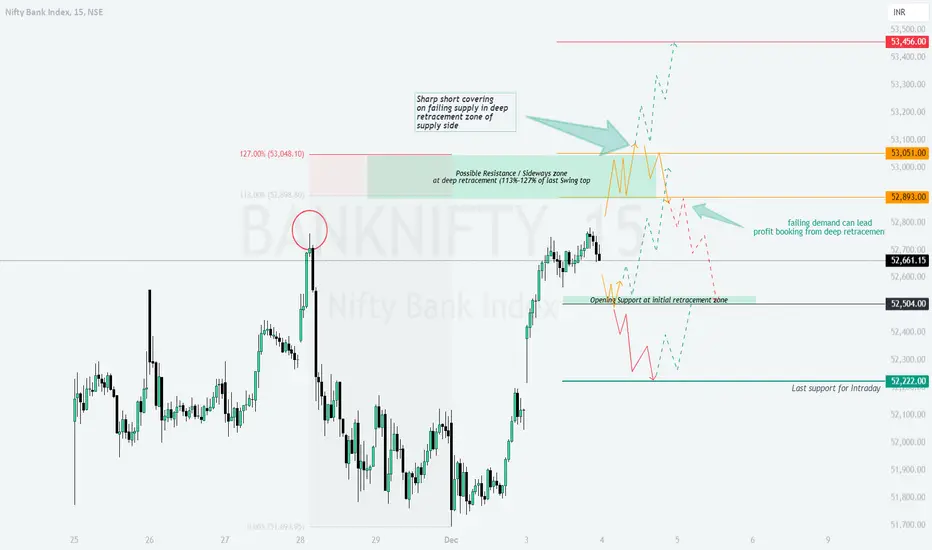
On the previous trading day, Bank Nifty experienced sharp upward move after opening and close with in a range ( mentioned in yesterday's plan), particularly in the deep retracement zone between 113%-127% of the last swing high, highlighting a potential exhaustion of sellers. The price action near ₹52,893 indicates failing demand, which may lead to profit booking. The levels around ₹53,051 act as a probable resistance zone, while initial support lies near ₹52,504. Yellow indicates a sideways trend, green shows bullish momentum, and red signifies bearish trends.
Here’s a structured trading plan for all opening scenarios:
Gap Up Opening (+200 points or more above ₹52,661)
Resistance Zone Focus (₹52,893-₹53,051): A gap-up opening near or above ₹52,893 will push the index into a potential resistance zone. Watch for rejection patterns, such as bearish engulfing, to confirm profit booking.
Action Plan:
Entry: Short near ₹53,051 after a bearish confirmation.
Target: ₹52,661 (current price level) and ₹52,504 (initial retracement zone).
Stop Loss: Above ₹53,150 to manage risk.
Breakout Potential Above ₹53,051: Sustained buying above ₹53,051 could lead to further upside toward ₹53,456.
Action Plan:
Entry: Long above ₹53,051 after a 15-minute candle closes above this level.
Target: ₹53,300-₹53,456.
Stop Loss: Below ₹52,893 to avoid false breakouts.
Flat Opening (Near ₹52,661)
Opening Support (₹52,504-₹52,661): If the market opens flat, initial focus should remain on whether Bank Nifty sustains above ₹52,504. A break below this level could trigger further downside.
Action Plan for Bullish Scenario:
Entry: Long above ₹52,661 with strong buying momentum.
Target: ₹52,893 and ₹53,051.
Stop Loss: Below ₹52,500 to limit downside risk.
Action Plan for Bearish Scenario:
Entry: Short below ₹52,504 with selling pressure confirmation.
Target: ₹52,222 (last support for intraday).
Stop Loss: Above ₹52,661 for safety.
Retracement Levels Monitoring (₹52,504): If the price trades sideways near ₹52,504, look for breakout patterns in either direction to confirm the trend.
Gap Down Opening (-200 points or more below ₹52,661)
Testing Demand Zone (₹52,222): A gap-down opening below ₹52,504 will test the last intraday support zone around ₹52,222. Failure to hold this level could intensify the bearish momentum.
Action Plan:
Entry: Short below ₹52,222 after bearish confirmation.
Target: ₹52,000-₹51,800 (extended retracement zones).
Stop Loss: Above ₹52,350 to minimize risk.
Reversal Potential at ₹52,222: Watch for bullish reversal patterns like hammers or bullish engulfing candlesticks near ₹52,222.
Action Plan:
Entry: Long near ₹52,222 with a confirmed reversal.
Target: ₹52,504 and ₹52,661.
Stop Loss: Below ₹52,100 to manage risk.
Risk Management Tips for Options Trading
Adopt strict stop-loss discipline to avoid large losses, especially in volatile conditions.
Trade with limited risk strategies like iron condors or debit spreads to manage margin requirements.
Focus on option strikes with sufficient liquidity (At-The-Money or slightly Out-Of-The-Money options).
Avoid over-leveraging; trade only with capital you can afford to lose.
Use a defined reward-to-risk ratio (preferably 2:1 or higher).
Summary and Conclusion
The Bank Nifty is trading near crucial zones, with ₹52,893 as a key resistance area and ₹52,504 acting as the immediate support. A breach above ₹53,051 could lead to bullish momentum, while a fall below ₹52,222 would extend bearish trends. Stick to the plan, wait for confirmation, and execute with discipline.
Disclaimer:
I am not a SEBI-registered analyst. This analysis is for educational purposes only. Please consult your financial advisor or conduct your research before making any trading decisions.
BANKNIFTY SELL SETUP FOR 03/11/2024, 04/11/2024 & 05/11/2024**Explanation:**
This trading system helps you avoid blind trades by providing confirmation for better entries and exits. It considers volume, past prices, price range and INDIAVIX.
**Entry/Exit Points:**
- **Entry/Exit Lines:** Use the BLACK line for long trades and the RED line for short trades, based on confirmation from your trading plan.
- **Stop Loss:** For long trades, set the stop loss at the RED line below. For short trades, set it at the BLACK line above.
- **Take Profit:** For long trades, target the next RED line above. For short trades, target the next BLACK line below.
**Timeframe:**
Use a 15 timeframe for trading.
**Risk Disclaimer:**
This setup is for educational purposes. I'm not responsible for your gains or losses. Check the chart for more details.

BANKNIFTYNSE:BANKNIFTY
WAIT and Watch!
Could be Tricky!!!!!
Expecting reversal from here...
lets see, Fingers crossed.
Note :
1. One should go long with a StopLoss, below the Trendline or the Previous Swing Low.
2. Risk :Reward ratio should be minimum 1:2.
3. Plan your trade as per the Money Mangement and Risk Appetite.
Disclamier : You are responsible for your profits and loss.
The idea shared here is purely for Educational purpose.
Follow back, for more ideas and thier notifications on your email.
Support and Like incase the idea works for you.

Bank Nifty Trend Analysis for 03/12/2024Bank Nifty Trend Analysis for 03/12/2024
Key Levels
Average Level: 51,926 (Pivot Zone)
Possible Upward Targets:
First Target: 52,197
Second Target: 52,700
Possible Downward Targets:
First Target: 51,930
Market Trend Outlook
Upside Scenario
If Bank Nifty sustains above the average level of 51,926, it indicates bullish sentiment.
Target 1: 52,197 (+0.5%) – This is the immediate resistance; a breakout can drive further momentum.
Target 2: 52,700 (+1.5%) – Represents the next resistance level where profit booking may occur.
Downside Scenario
A break below 51,926 signals weakness, leading to a move toward the first support at 51,930.
Further selling below 51,930 may trigger increased bearish pressure, with deeper levels to be monitored.
Market Movement Expectation for the Day
Likely Trend: Bank Nifty is expected to remain range-bound, oscillating between 51,926 and 52,197, unless there’s a strong external trigger.
Volatility: Moderate, with chances of sharper moves near breakout or breakdown levels.
Recommendations for Traders
For Long Positions:
Enter above 51,926, with targets of 52,197 and 52,700.
Keep a stop-loss near 51,930 for risk management.
For Short Positions:
Initiate below 51,930, targeting lower levels.
Stop-loss at 52,000 to limit risk.
Conclusion
The 51,926 level is the key pivot for today. Sustained trading above it favors bulls, while a breach below it could lead to bearish momentum. Monitor price action near these levels to confirm the trend.

[INTRADAY] #BANKNIFTY PE & CE Levels(03/12/2024)Today will be flat or slightly gap up opening expected in banknifty. After opening if it's sustain above 52050 level then expected upside rally upto 52450+ level in today's session. Expected banknifty will trade in between range of 52050 to 52450 zone. In case banknifty starts trading below 51950 level then possible major downside rally in index.

Banknifty | 3rd Dec'20243m: Price at strong resistance; wait for bearish confirmation after a nearby buy-side liquidity sweep to short.
15m: If 3m shows no bearish confirmation, watch for a buy-side liquidity sweep on 15m, then await bearish confirmation to short.
*Remember overall 15m trend is bearish!

BANKNIFTY : Trading Levels for 03-Dec-2024Bank Nifty Trading Plan for 03-Dec-2024
Previous Day’s Chart Pattern Analysis:
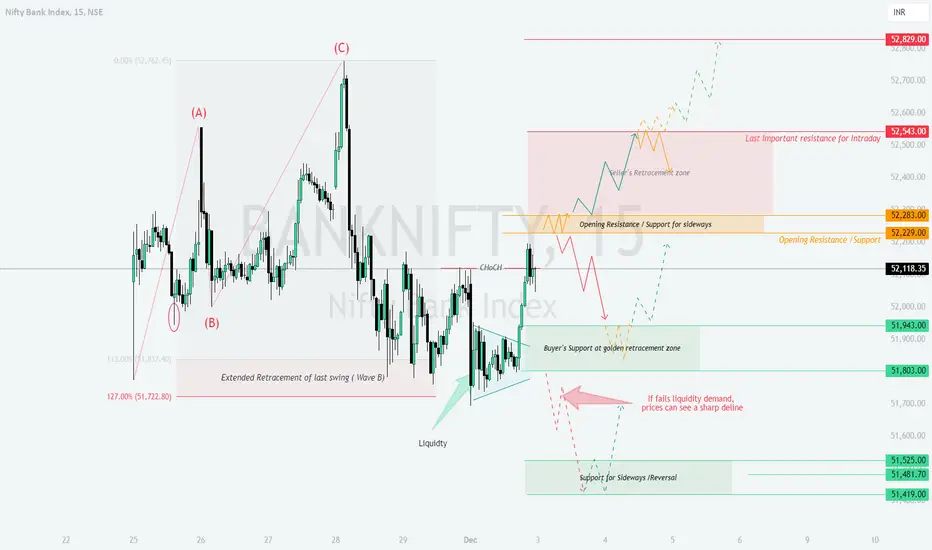
BANKNFITY has a strong strong form extended retracement zone of Wave B of last swing structure and managed to close near day's high after mitigating liquidity form the levels mentioned in yesterdays plan. The chart highlights a liquidity grab at lower levels, followed by a rally towards 52,229 Opening Resistance/Support Zone, indicating bullish intent. Yellow lines represent consolidation phases, green lines signal bullish trends, and red lines indicate bearish declines. The levels of 52,543 and 51,943 played a critical role in shaping the market sentiment.
For next session, expect dynamic movements around these levels based on opening scenarios.
Opening Scenarios for 03-Dec-2024:
Scenario 1: Gap Up Opening (200+ Points Above 52,118)
If Bank Nifty opens above 52,318, focus on the immediate resistance zone at 52,543 Seller's Retracement Zone.
- Action Plan:
- If the price sustains above 52,543, initiate long trades targeting the 52,829 Last Important Resistance for Intraday. Maintain a stop-loss at 52,283 Opening Resistance/Support Zone.
- Failure to sustain above 52,543 may lead to a pullback towards 52,283. Observe price action here before considering short trades targeting 52,229.
- Risk Management Tip: Avoid aggressive entries near the opening bell. Wait for a retest of key levels to confirm direction. Use call spreads for upside momentum.
Scenario 2: Flat Opening (Near 52,118)
In the case of a flat opening, monitor the 52,229 Opening Resistance/Support Zone for price action.
- Action Plan:
- If the price decisively breaks above 52,283, go long with targets of 52,543 and then 52,829. Place a stop-loss at 52,118.
- A failure to hold 52,229 could see the index retest 51,943 Buyer's Support at Golden Retracement Zone. Short positions can be considered with a target of 51,803, keeping a stop-loss at 52,283.
- Risk Management Tip: Wait for the first 30 minutes to let the trend stabilize. Use protective puts or hedged positions during flat openings.
Scenario 3: Gap Down Opening (200+ Points Below 52,118)
A gap-down opening below 51,943 would bring the 51,803 Support Zone into focus.
- Action Plan:
- If the price finds support at 51,803, expect a bounce towards 51,943. Go long with a stop-loss at 51,525 Support for Reversal.
- Breaching 51,803 might lead to sharp declines, targeting 51,525 and 51,419 Extended Retracement of Last Swing. Short positions can be initiated below 51,803 with tight stop-losses above 51,943.
- Risk Management Tip: Use out-of-the-money puts for bearish momentum. Avoid oversizing positions in volatile conditions.
Risk Management Tips for Options Trading:
Always define your risk before entering a trade. Risk no more than 1-2% of your capital on a single trade.
Use hedging strategies like bull call spreads or bear put spreads to limit potential losses.
During high volatility, prefer index options over individual stocks for better liquidity.
Summary and Conclusion:
Key levels to watch today are 52,543, 52,283, and 51,943.
Bullish scenario: Sustained movement above 52,543 could lead to targets of 52,829.
Bearish scenario: Breaking below 51,803 may trigger a slide towards 51,525.
Sideways scenario: Expect consolidation between 52,229 and 51,943, with trading opportunities emerging on breakouts or breakdowns.
Disclaimer:
I am not a SEBI-registered analyst. This trading plan is for educational purposes only. Please conduct your own analysis or consult a financial advisor before making any trading decisions.
Bank nifty technical analysis for trading (03/Dec/2024)Bank nifty moments for option and future trading 03/Dec/2024
follow us for more updates information.
message us for any stocks related information

#109 GENIE IDEA BANKNIFTY ANALYSIS OPTION #109 GENIE IDEA I will daily post intraday/swing/positional trading opportunities so u can analyse and get the most from it. if you like my analysis do like and follow me as a token of appreciation. And if you have any queries let me know.
Leave a comment that is helpful or encouraging.

#106 BANKNIFTY option analysis#106 BANK NIFTY OPTION. I'm not a Sebi resisted person. Follow for more updates

Banknifty Forecast for 2nd Dec'2024The trend is bearish and may follow one of these scenarios:
1. Likely to grab all buy-side liquidity before continuing bearish.
2. Likely to grab available retail liquidity before continuing bearish.
3. Likely to drop aggressively bearish, then reverse bullish to grab buy-side liquidity.

[INTRADAY] #BANKNIFTY PE & CE Levels(02/12/2024)Today will be gap up opening expected in banknifty near 52500 level. After opening if banknifty starts trading above 52550 level then expected further bullish rally towards the 52950 level. After opening it will immediately face resistance at 52500 level if any reversal then possible downside movement upto 52050 and this can be extend for further 400-500 points if banknifty gives breakdown of 51950 level.

Bank Nifty | Pre-Market | Dec 2024 | Week-1Bank Nifty closed the previous week with some Bullishness breaking out from the trend line resistance forming since 27 Sep 2024.
Last weeks candle was an indecision candle.
It's quite likely that BN fills the gap created by last weeks gap up opening.
Bank Nifty should turn Bullish only once it starts trading above the 50% zone of the previous fall which is above 52,200 level.
For the upcoming week, for now, Bank Nifty is in a trap zone since it is trading above December Monthly Pivot but below next week's Pivot.
Long View ~ Above 52,625
No trade view for any level in between.

BANKNIFTY : Trading levels and plan for 02-Dec-2024Bank Nifty Trading Plan for 02-Dec-2024
On 01-Dec-2024, Bank Nifty exhibited a balanced market structure, fluctuating between the Golden Retracement Zone for sellers (52,221–52,283) and key supports near 51,545 and 51,181. The market witnessed multiple Change of Character (ChoCH) formations, indicating short-term trend reversals. The chart highlighted Yellow Zones for sideways consolidation, Green Zones for bullish trends, and Red Zones for bearish trends. Significant resistance near 52,583 capped the upward moves, while supports near 51,444 and 51,181 limited the downside.
Detailed Trading Plan for 02-Dec-2024
Gap-Up Opening (Above 52,221, up to 200+ points)
If Bank Nifty opens with a gap-up beyond 52,221, it enters the Golden Retracement Zone for sellers (52,221–52,283):
Plan A (Bearish Scenario): Look for a rejection near 52,283. If confirmed, initiate short positions targeting 52,221 first, followed by 52,023 as a second target.
Plan B (Bullish Scenario): If Bank Nifty breaks above 52,283 and sustains for an hourly candle, consider going long with targets of 52,583 and the Last Intraday Resistance at 52,829.
Avoid aggressive buying near 52,283 unless a strong breakout is evident. Let the price action validate the trend.
Flat Opening (Between 52,023 and 51,937)
In the event of a flat opening, focus on the immediate support and resistance levels around 52,023 (Opening Support):
Plan A (Bullish Scenario): If prices hold above 52,023, initiate long positions, targeting 52,221 and 52,283.
Plan B (Bearish Scenario): If Bank Nifty falls below 52,023, expect a move toward the No Trade Zone near 51,937–51,840. Breach of 51,840 could lead to a test of 51,545.
Monitor momentum indicators closely during flat openings, as they often provide early signals for directional bias.
Gap-Down Opening (Below 51,840, down to 200+ points)
A gap-down opening below 51,840 signals bearish sentiment:
Plan A (Bullish Reversal): Observe if buyers defend 51,545 or 51,444. If a reversal pattern emerges, go long, targeting 51,840 and 51,937.
Plan B (Extended Bearish Move): If 51,444 is decisively broken, expect further downside toward 51,181 and 51,081, which are the extended retracement levels for buyers.
In gap-down scenarios, trade smaller lot sizes initially to manage risk effectively in volatile conditions.
Risk Management Tips for Options Traders
Avoid overtrading near critical levels like 52,283 or 51,545 without clear confirmation.
Use strategies such as Iron Condors or Straddles to capitalize on range-bound movements in Yellow Zones.
Always hedge directional trades, especially near volatile zones like the Opening Resistance or Support.
Summary and Conclusion
Bank Nifty’s key levels for 02-Dec-2024 include 52,283 (Opening Resistance), 51,937–51,840 (No Trade Zone), and 51,545 (Support for Consolidation). Yellow zones indicate potential sideways action, while Green and Red zones guide bullish and bearish trends. Exercise caution around high-impact levels and focus on hourly candle closures for trend validation.
Disclaimer
I am not a SEBI-registered analyst. This analysis is for educational purposes only. Please consult your financial advisor before making trading decisions.

VIEW ON NIFTY AND BANKNIFTYNifty and Bank nifty view for coming weeks.
Dollar Index, Gold, US market and 10 year US Gsec
Disclaimer -
The information provided herein is for educational purposes only. It does not constitute financial, investment, or trading advice and should not be construed as such. Consult a qualified financial advisor before making any financial decisions.
We are not liable for any monetary loss, that may arise directly or indirectly from the use of or reliance on the information provided.

BANK NIFTY @ 52055 Analysis 01-DEC-2024BANK NIFTY @ 52055 Analysis 01-DEC-2024
Supports: 49755/47370
Resistance: 54555
As long as 49755 holds support, I expect to see 55000, 58000, 64000, 67800
Long term targets: 73600, 77500, 83500, 92000, 103000, 109000

BANK NIFTY S/R for 2/12/24Support and Resistance Levels:
Support Levels: These are price points (green line/shade) where a downward trend may be halted due to a concentration of buying interest. Imagine them as a safety net where buyers step in, preventing further decline.
Resistance Levels: Conversely, resistance levels (red line/shade) are where upward trends might stall due to increased selling interest. They act like a ceiling where sellers come in to push prices down.
Breakouts:
Bullish Breakout: When the price moves above resistance, it often indicates strong buying interest and the potential for a continued uptrend. Traders may view this as a signal to buy or hold.
Bearish Breakout: When the price falls below support, it can signal strong selling interest and the potential for a continued downtrend. Traders might see this as a cue to sell or avoid buying.
MA Ribbon (EMA 20, EMA 50, EMA 100, EMA 200) :
Above EMA: If the stock price is above the EMA, it suggests a potential uptrend or bullish momentum.
Below EMA: If the stock price is below the EMA, it indicates a potential downtrend or bearish momentum.
Trendline: A trendline is a straight line drawn on a chart to represent the general direction of a data point set.
Uptrend Line: Drawn by connecting the lows in an upward trend. Indicates that the price is moving higher over time. Acts as a support level, where prices tend to bounce upward.
Downtrend Line: Drawn by connecting the highs in a downward trend. Indicates that the price is moving lower over time. It acts as a resistance level, where prices tend to drop.
Disclaimer:
I am not a SEBI registered. The information provided here is for learning purposes only and should not be interpreted as financial advice. Consider the broader market context and consult with a qualified financial advisor before making investment decisions.

Weekly Analysis 30/11/2024. Stocks in watchlist for next weekI have discussed about the stocks that are in my watchlist for next week.

Banknifty moments for option and future trading 02/Dec/2024Nifty moments for option and future trading 02/Dec/2024
follow us for more updates information.
message us for any stocks related information
WELCOME TO ARROWINDEX
We're dedicated to providing you the best of Finance stock market , with a focus on dependability and Investment. We're working to turn our passion for Finance stock market into a booming online.We analyze Live Market and try to Provide learning information Content. All the Live Market views and charts .We hope you enjoy our Finance stock market as much as we enjoy offering them to you.Support and offering
Effective online education modules for all segments of traders
Customized portfolio tracker Online research & trading guidance
Entry and Exit support for:-
Intraday trading,Swing trading,Scalping,Position trading
Future & Delivery trading
Technical analysis
Fundamentals analysis
Fii & Dii data and reports

Understanding ICT Classic Weekly Profile on BANKNIFTYICT weekly profiles are conceptual frameworks that describe typical patterns of price behavior during a trading week.
Each ICT weekly profile has unique characteristics that can hint the traders in anticipating potential market movements.
However, it is important to note that these profiles are not fixed predictions but rather frameworks to understand market tendencies and works with Higher Time Frame PD arrays confluences.
ICT weekly profile is explained below with BANKNIFTY Chart analysis
Classing Thursday High of Week (Bearish Setup)
Key element to focus :
Higher Time Frame Premium array (Weekly Buy Side Liquidity) for bearish setup
Time Frames alignment :
HTF --> W1 (PD Arrays)
LTF ---> H4 (Market Structure)
ETF --> M15 (Entry)
Process :
1. Market offers Liquidity from Monday to Wednesday
2. Market seeks Liquidity on Thursday
3. Market rebalances on Friday

Is BankNifty Going to make a fresh ATH?Looks like after a false breakdown, banknifty have made a fresh breakout in daily charts and retested the breakout. Now continuation is anticipated. So if continues, 54600 maybe the next target.

BANKNIFTY will go upwards a little moreDESCENDING RECTANGLE BREAKOUT -
Banknifty has broken ou t of a strong rectangle pattern on 15 min chart with good confirmation
GAP-UP BREAKOUT -
The breakout occurred with a gap-up indicating strong upwards momentum
SUPPORT FROM 30D SMA -
apartfrom this it had also taken support from 30D SMA during the closing of the previous day indicating there is potential for upward momentum
5-MIN TIMEFRAME -
the pattern and the breakout is even more clear on 5-min timeframe
