Bank Nifty Trend Analysis for Today – 26/11/2024Bank Nifty Trend Analysis for Today – "26/11/2024"
Key Levels for Bank Nifty
Average Level: 52,170 – This is the pivot point for today's session and a critical level to watch for market direction.
Upside Potential
If Bank Nifty sustains above the average level of 52,170, it signals bullish momentum.
First Resistance/Target: 52,300
A breakout above this level could indicate further strength in the index.
Second Resistance/Target: 54,300
Strong buying activity could drive the index toward this higher target, representing significant upside potential (+4%).
Downside Risk
If Bank Nifty breaks below 52,170, it may indicate bearish pressure.
First Support/Target: 52,000
A minor dip toward this level could still allow recovery if buying resumes.
Second Support/Target: 49,900
A sustained break below this zone may lead to a deeper correction (-4.3%).
Trend Expectation
Range-Bound or Breakout?
Likely to trade within the range of 52,000–52,300 during initial hours unless external triggers drive a decisive breakout.
A breakout above 52,300 could lead to a 1%–2% rally, while a breakdown below 52,000 could trigger a decline toward 49,900.
Trading Strategy for the Day
Bullish Setup:
Go long above 52,300, targeting 54,300.
Use 52,170 as a trailing stop-loss to manage risk.
Bearish Setup:
Go short below 52,000, targeting 49,900.
Place a stop-loss at 52,170 to protect against reversals.
Conclusion:
The 52,170 level will act as the pivot today. A clear breakout or breakdown will confirm the direction for Bank Nifty. Trade cautiously and follow disciplined risk management.
BANKNIFTY trade ideas

Bank Nifty 26th Forecast | NSE | Wait for Bearish Confirmationgrabbed max buy-side lq
likely move to bearish in coming days after bearish confirmation
waiting for the bearish confirmation today
market will reach to sell-side demand zone

[INTRADAY] #BANKNIFTY PE & CE Levels(26/11/2024)Today will be flat or slightly gap up opening expected in banknifty. After opening if banknifty starts trading above 52550 level then expected sharp upside rally upto 52950 level in today's session. Downside 52050 level will act as a strong support for today's session. Any major downside only expected below 51950 level.

Nifty Bank Prediction for 26th November 2024Nifty Bank Prediction for 26th November 2024
Nifty bank moments for intraday and option trading.
Bank Nifty opened higher at 52,046.35 on Monday, reaching an intraday high of 52,331.10 during the opening bell, marking a sharp intraday rally of approximately 1,000 points before closing at 52,207.50.
This performance extended Friday's gains, driven by strong buying interest in PSU stocks, which saw the PSU index rise by 7% over the last two sessions. The rally was fueled by positive market sentiment following the BJP's victory in the Maharashtra elections.
On the daily chart, Bank Nifty closed above the 50-day SMA with a gap-up opening, signaling short-term optimism. Looking ahead, the index has key support levels at 51,800 and 51,500, while resistance is anticipated around 52,600 and 53,000.

BANKNIFTY : Trading Levels and Plan for 26-Nov-2024Bank Nifty Trading Plan for 26th November 2024
Intro:
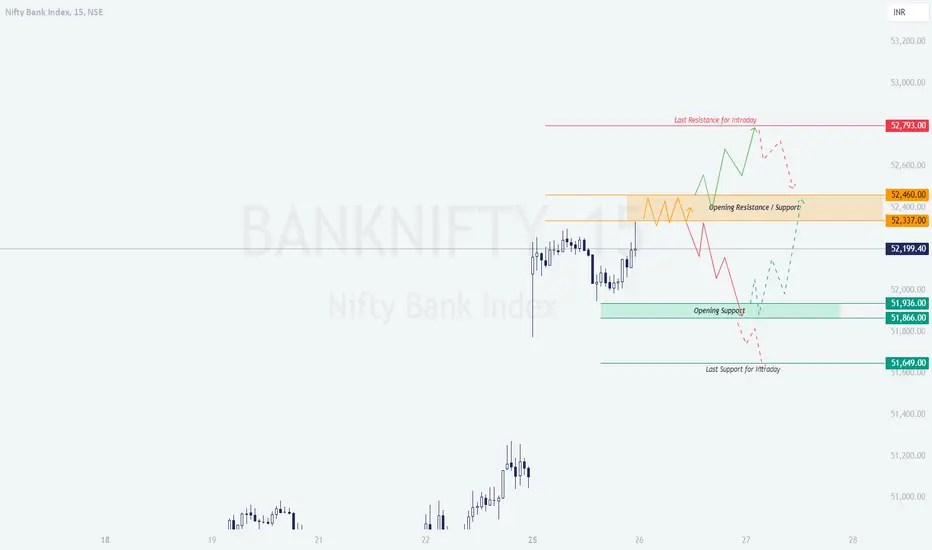
In the previous trading session, Bank Nifty showed a strong upward movement but faced resistance near the 52,200 - 52250 level, forming a consolidation pattern. The chart indicates key levels for the next trading day. Yellow trendlines represent a sideways movement, green trendlines represent a bullish trend, and red trendlines indicate a bearish trend. Based on the chart, here’s a detailed trading plan for 26th November 2024, covering all potential opening scenarios.
Gap Up Opening (200+ Points Above Previous Close):
If Bank Nifty opens above 52,460, the index will enter a key resistance zone (52,460–52,793). Watch for a breakout above 52,793. If it sustains above this level, look for bullish opportunities toward the next target at 53,200. If resistance at 52,460–52,793 holds and Bank Nifty shows signs of rejection, a pullback to 52,337 or even 52,199 is possible. Be cautious about reversals in this zone. Avoid aggressive longs if the price struggles near 52,460 and fails to break out decisively.
Flat Opening (Within ±50 Points):
Monitor price action at 52,337–52,460. This zone will act as the immediate resistance. If Bank Nifty consolidates or shows rejection here, expect a move toward the opening support at 51,936–51,866. For bullish opportunities, wait for a breakout above 52,460 with strong volume confirmation. Targets remain 52,793 and 53,200. If the index breaks below 52,199, the bearish scenario will dominate, and we may see levels around 51,866 or even the last intraday support at 51,649.
Gap Down Opening (200+ Points Below Previous Close):
A gap down below 52,199 will bring the focus to the 51,936–51,866 support zone. Watch for reversal patterns or strong buying cues in this area for a possible upward bounce. If the price breaks below 51,866, the index could slide further to test 51,649. A failure to hold 51,649 may trigger a deeper bearish move toward 51,500 or lower. Any bullish attempts will require the index to reclaim 52,199 with conviction before targeting 52,337 or higher.
Risk Management Tips for Options Trading: Always calculate risk-reward before entering a trade. Avoid taking trades with a risk-reward ratio below 1:2. Keep position size small, especially if trading volatile options or on uncertain days. Use stop-loss orders for every trade and stick to them. For intraday trading, avoid carrying losses into the next day. Avoid chasing trades after a significant move; wait for pullbacks or clear confirmation. Monitor implied volatility (IV) while trading options. High IV means premium decay can occur rapidly if momentum stalls.
Summary and Conclusion:
The 52,460 level remains the critical zone to watch for bullish momentum. A break and sustain above it could take Bank Nifty to 52,793 or higher. Conversely, failure to hold above 52,199 may lead to testing of lower supports at 51,936 and 51,649. Be cautious and wait for clear confirmation before executing trades. Sideways consolidation may occur if Bank Nifty remains stuck in the range of 52,199–52,460.
Disclaimer:
This analysis is for educational purposes only. I am not a SEBI-registered analyst. All views and levels mentioned here are based on personal technical observations. Please consult your financial advisor and perform your own research before trading or investing.
BANK NIFTY S/R for 26/11/24Support and Resistance Levels:
Support Levels: These are price points (green line/shade) where a downward trend may be halted due to a concentration of buying interest. Imagine them as a safety net where buyers step in, preventing further decline.
Resistance Levels: Conversely, resistance levels (red line/shade) are where upward trends might stall due to increased selling interest. They act like a ceiling where sellers come in to push prices down.
Breakouts:
Bullish Breakout: When the price moves above resistance, it often indicates strong buying interest and the potential for a continued uptrend. Traders may view this as a signal to buy or hold.
Bearish Breakout: When the price falls below support, it can signal strong selling interest and the potential for a continued downtrend. Traders might see this as a cue to sell or avoid buying.
20 EMA (Exponential Moving Average):
Above 20 EMA(50 EMA): If the stock price is above the 20 EMA, it suggests a potential uptrend or bullish momentum.
Below 20 EMA: If the stock price is below the 20 EMA, it indicates a potential downtrend or bearish momentum.
Trendline: A trendline is a straight line drawn on a chart to represent the general direction of a data point set.
Uptrend Line: Drawn by connecting the lows in an upward trend. Indicates that the price is moving higher over time. Acts as a support level, where prices tend to bounce upward.
Downtrend Line: Drawn by connecting the highs in a downward trend. Indicates that the price is moving lower over time. It acts as a resistance level, where prices tend to drop.
RSI: RSI readings greater than the 70 level are overbought territory, and RSI readings lower than the 30 level are considered oversold territory.
Combining RSI with Support and Resistance:
Support Level: This is a price level where a stock tends to find buying interest, preventing it from falling further. If RSI is showing an oversold condition (below 30) and the price is near or at a strong support level, it could be a good buy signal.
Resistance Level: This is a price level where a stock tends to find selling interest, preventing it from rising further. If RSI is showing an overbought condition (above 70) and the price is near or at a strong resistance level, it could be a signal to sell or short the asset.
Disclaimer:
I am not a SEBI registered. The information provided here is for learning purposes only and should not be interpreted as financial advice. Consider the broader market context and consult with a qualified financial advisor before making investment decisions.

BN | Short Trade | SwingBN as anticipated has gapped up straight into resistance zone and is struggling to find momentum.
I'm anticipating a failure from the highs through a price action and price to re-test the trend line drawn.
I have taken positions for December month expiry. 51600 PE bought.
I have hedged it with a far OTM PE Sell since I believe in trading only spreads unless it's a short burst trade.
Let's see...

[INTRADAY] #BANKNIFTY PE & CE Levels(25/11/2024)Today will be huge gap up opening expected in banknifty almost near 52000 level. After opening if banknifty starts trading above 52050 level then this gap up bullish rally extend for further 500-1000 points towards to 52450 and 52950 levels. Any correction rally expected below 51950 level.

BANKNIFTY: INSTITUTIONAL LEVELS FOR 25/11/2024Overview
This trading system combines simplicity with powerful insights for accurate entries and exits. It is structured for active traders using the 5-minute timeframe who want to make clear, confident trading decisions in fast-moving markets.
Key Strategy Guidelines
Retest Entries : Aim to enter trades on retests rather than breakouts, offering better positioning.
Multiple Confirmations : Use more than one confirmation to validate each trade, helping avoid impulsive decisions.
ATM Options Focus : Stick to at-the-money (ATM) options or above for optimal liquidity and manageable risk.
System Explanation
This setup leverages volume, historical price action, and price ranges to pinpoint high-probability entry and exit points. This methodology is designed to reduce guesswork, allowing traders to manage trades with a consistent approach.
How It Works: Entry/Exit Signals
Blue Line : Signals potential long entry.
Red Line : Indicates potential short entry.
Tip : Align these signals with additional confirmations from your trading strategy for optimal performance.
Stop Loss and Take Profit Levels
Stop Loss:
Long Trades : Set your stop loss at the nearest red line below the entry point, or adjust based on whether the 5-minute candle crosses the red line.
Short Trades : Use the blue line above as the stop loss.
Take Profit:
Long Entries :Target the next red line above or exit if other indicators suggest a prudent exit.
Short Entries :Target the next blue line below following similar guidelines.
Timeframe Recommendation
This system is specifically optimized for the 5-minute timeframe, making it suitable for those trading shorter intervals with precision.
Risk Disclaimer
Trading involves high risk, and rapid price changes can lead to unexpected losses. Only trade with capital you can afford to lose, and carefully assess your financial situation and risk tolerance.
Join the Community Discussion
Engage with other traders to discuss strategies, share insights, and enhance your understanding of the markets. Let’s grow together as a community of traders.
Original Content
This trading system is the product of my own expertise and rigorous testing. It’s a unique approach developed through real market experience to offer a clear edge in trading.

Bank Nifty 26th Nov 2024Date 26th Nov 2024
Time 9:15 am IST
BIAS
Monthly-Bullish
Weekly-Bearish
Daily-Not Sure
4Hr-Not Sure
1Hr-Not Sure
TRADE
GAP UP- Wat and watch. Look for Put trade after making sure there is no fresh buying
GAP DOWN- Look for Call trade from 50600 levels.
All trades to have small positions and book profits fasters. Dont load up for riding trades.

Bank Nifty | NSE | Intraday Forecast for November 25, 2024Strategy involves analyzing the 24th's daily candle and the 15-minute time frame after the market opens on the 25th. Here's a breakdown of the scenario:
Key Assumptions in the Strategy:
24th Daily Candle Analysis:
Its a strong bullish (BL) pattern, expect a potential gap-up opening on the 25th.
25th Market Opening (15-minute chart focus):
Scenario 1: If the market breaks a strong resistance zone above, it is expected to range for a while.
Next Move: After consolidating (ranging), the market will decide the trend direction based on a zone breakout:
Bullish Breakout (BL side): Enter a long trade based on confirmations like increased volume, sustained breakout, or momentum indicators.
Bearish Breakdown (BR side): Enter a short trade once confirmations like rejection candles, lower highs, or volume surge appear.

BANKNIFTY - Levels and Plan for 25-Nov-2024Bank Nifty Trading Plan for 25-Nov-2024
Introduction:
In the previous session, Bank Nifty traded in a trend and meet all the target of the day and close around the 51150 - 51200 zone, with sideways consolidation ( Yellow ) dominating near key levels. The resistance at 51,304 and the support at 50,919 held firm, indicating indecision in the market. Today, the market is likely to remain sensitive to these levels, with breakout trends ( Green for bullish) or breakdown trends ( Red for bearish) shaping intraday opportunities.
Trading Scenarios for 25-Nov-2024:
Gap-Up Opening (200+ points):
If Bank Nifty opens above 51,304 , the key focus will shift to the immediate resistance zone at 51,917 :
A breakout above 51,917 could lead to a strong bullish rally toward 52,100 . Look for sustained price action above this level to confirm the trend.
Failure to sustain above 51,917 may result in a pullback toward 51,304 , providing an opportunity for intraday short trades.
Patience is crucial during the opening minutes to gauge market sentiment.
Flat Opening:
A flat opening near 51,098 will bring the "No Trade Zone" between 51,034 and 51,304 into play:
A bullish breakout above 51,304 could signal further upside toward 51,917 .
Conversely, a breakdown below 51,034 may lead to bearish momentum targeting 50,919 and lower.
Avoid trading within the "No Trade Zone" to minimize false signals. Wait for clear price action confirmation before entering positions.
Gap-Down Opening (200+ points):
If Bank Nifty opens below 50,919 , the next critical support lies at 50,525 :
A breakdown below 50,525 could result in a sharp sell-off, with the next target being 50,100 . Monitor volume and candlestick patterns for confirmation.
A bounce from 50,525 could indicate recovery, with potential upside back to 50,919 and 51,034 .
Be cautious during a gap-down scenario, as volatility can lead to whipsaw movements.
Risk Management Tips for Options Trading:
Trade near-the-money strikes for higher liquidity and better responsiveness to price changes.
Use strict stop-loss levels based on key support and resistance zones to protect capital.
Avoid trading during the "No Trade Zone" to minimize unnecessary losses.
Scale into positions gradually instead of committing the full capital at once, especially in volatile markets.
Summary and Conclusion:
The market's movement today will revolve around the critical zones of 51,304 and 51,034 . Patience and discipline are essential to capitalize on clear breakout or breakdown opportunities. Stick to the plan, avoid overtrading, and respect stop-loss levels for effective risk management.
Disclaimer: I am not a SEBI-registered analyst. The analysis shared is for educational purposes only. Please consult your financial advisor before making any trading decisions.

Banknifty moments for intraday and option trading 25/Nov/2024Banknifty moments for intraday and option trading 25/Nov/2024
follow us for more updates and information.

Bank Nifty | Pre Market Report | 25 Nov ~ 29 NovBN ended the previous week on a positive note taking a much needed and anticipated support from the 200 DEMA.
For now, even though the intermediate trend has changed to Bullish, in my view the master trend still continues to be on the Bearish side.
So, when will that turn Bullish? When 52,400 is breached strongly on the upside.
Technically, once price crosses the Monthly Pivots which are at 51,630 we should see more Bullish bias. However, I would still like to see 52,400 to be taken out strongly which would then make BN move into a 'Buy on Dip' mode.
For the upcoming week, my view is that BN could be sideways and can face resistance around the trend line as shown which also coincides with the strong weekly resistance at 51,700.
My Plan for BN in case of a gap up opening would be to wait out for the Bulls to get exhausted and then take a reversal trade from 51,700. Till then, I would not be participating on the Long side.
In case of a Flat or Gap down opening, my plan would be to look for appropriate Bullish price action and look for a long trade if price sustains above 51,100 for a Target till 51,700.
Intraday updates will follow as and when I spot good signals. Trade Responsibly!

BANK NIFTY S/R for 25/11/24Support and Resistance Levels:
Support Levels: These are price points (green line/shade) where a downward trend may be halted due to a concentration of buying interest. Imagine them as a safety net where buyers step in, preventing further decline.
Resistance Levels: Conversely, resistance levels (red line/shade) are where upward trends might stall due to increased selling interest. They act like a ceiling where sellers come in to push prices down.
Breakouts:
Bullish Breakout: When the price moves above resistance, it often indicates strong buying interest and the potential for a continued uptrend. Traders may view this as a signal to buy or hold.
Bearish Breakout: When the price falls below support, it can signal strong selling interest and the potential for a continued downtrend. Traders might see this as a cue to sell or avoid buying.
20 EMA (Exponential Moving Average):
Above 20 EMA(50 EMA): If the stock price is above the 20 EMA, it suggests a potential uptrend or bullish momentum.
Below 20 EMA: If the stock price is below the 20 EMA, it indicates a potential downtrend or bearish momentum.
Trendline: A trendline is a straight line drawn on a chart to represent the general direction of a data point set.
Uptrend Line: Drawn by connecting the lows in an upward trend. Indicates that the price is moving higher over time. Acts as a support level, where prices tend to bounce upward.
Downtrend Line: Drawn by connecting the highs in a downward trend. Indicates that the price is moving lower over time. It acts as a resistance level, where prices tend to drop.
RSI: RSI readings greater than the 70 level are overbought territory, and RSI readings lower than the 30 level are considered oversold territory.
Combining RSI with Support and Resistance:
Support Level: This is a price level where a stock tends to find buying interest, preventing it from falling further. If RSI is showing an oversold condition (below 30) and the price is near or at a strong support level, it could be a good buy signal.
Resistance Level: This is a price level where a stock tends to find selling interest, preventing it from rising further. If RSI is showing an overbought condition (above 70) and the price is near or at a strong resistance level, it could be a signal to sell or short the asset.
Disclaimer:
I am not a SEBI registered. The information provided here is for learning purposes only and should not be interpreted as financial advice. Consider the broader market context and consult with a qualified financial advisor before making investment decisions.

Bank Nifty Short level with small SL with moderate targetBank nifty fallen badly from here. Hope it shows some reaction

BANKNIFTY Analysis - Buy on DipGETTEX:NSE : BANKNIFTY
//----------------------------------------------------------------------------------
BANKNIFTY Analysis - Buy on Dip
//----------------------------------------------------------------------------------
Looking Bullish & Formed Morning Star Candle Pattern on Daily Chart
if Manages to Hold Today's High
Then it Can Trade till 52493.50 Where it will find short-term resistance & 52500 is the PSYCHOLOGICAL Level
Stock Will be Bullish Above 51271.50
Buy on Dip if found near PSYCHOLOGICAL Level 51000 or at T1 - 50983.50
//----------------------------------------------------------------------------------
Resistance above:- 🔴🔴🔴🔴
//----------------------------------------------------------------------------------
T1-50983.50
T2-51353.50
T3-51742.70
T4-52169.05
T5-52493.95
T6-52782.75
T7-53357.70
ATH 54467.35
//----------------------------------------------------------------------------------
Support Below:- 🟩🟩🟩🟩
//----------------------------------------------------------------------------------
S1-50508.25
S2-50382.10
S3-49787.10
//----------------------------------------------------------------------------------
Stock is Bullish & Now Any Dip can Be Utilied as Buy
BANKNIFTY Closed at 51135.40 & Showed some strength as a breakout Given.
Breakout Closing above the PSYCHOLOGICAL Level of 51000 & Sustaining above 50983 shows
Dow Theory is likely to be changed Now On a Daily Chart.
On Monday if Manages to Hold & Trade Above 51271.50 will trade till 52493.95
Possibility is High to hit Targets.
The Assembly Election Results of Maharashtra Will Drive the Market with Positive Sentiment.
India Vix is Cause of Worry 16.09
Buy is Generated & Indicator Given Signal.
//----------------------------------------------------------------------------------
Value of-
//----------------------------------------------------------------------------------
Ema_5 - 50746.61 Price is Above
Ema_50 - 51440.14 Price is Below
Ema_200 - 51150.06 Price is Below
BB_SMA_20 - 51293.70 Price is Below
RSI - 48.70
STOCHASTIC - 33.11
ADX - 23.49
//----------------------------------------------------------------------------------

banknifty-coming daysbanknifty needs to close above 51460 which is 61.8% of the entire decline to be entering the bullish zone in the short term
ibb.co

BANKNIFTY UPSIDE TARGET 52000Banknifty has formed inverse fvg on daily timeframe, earlier it had a bearish fvg, now it has closed above the bearish fvg on daily timeframe, it has upside potential towards 52000

BANKNIFTY-Corrective move upside may Trap you upside...!The chart the last breakdown from 6.Nov.24.
We may have completed the impulsive wave 1 to the down...and currently in a corrective bounce for wave 2.
Counts are marked on the chart and is not for any trade activity.

Will BankNifty revisit 52200?Symptoms of banknifty show a bullish infection which may lead it to 52200!! What do you think?

BANKNIFTY NOV 27 EXPIRY50300 CE & PE
TOTAL PREMIUM 901
TARGET 1111
SL 800
1:2 TARGET
Expecting breakout after long consolidation

Bank nifty - possibility Bank nifty is showing relative strength from quite long time.
Trend change possibility is there if it gives double bottom breakout.
Let's see how things unfold
