#Banknifty directions and levels for July 10th:Structurally, we are still in a range with a moderately bullish bias. So, until the range is broken, we may not get any clear direction.
However, my expectation is that if the market initially pulls back, it could continue the rally with some consolidation.
In this case, if a solid structure forms, we can expect a longer rally.
On the other hand, if the market declines and finds support around the immediate support level, it may continue to stay in the range.
Or, if a solid structure forms on the downside, then the correction is likely to continue.
BANKNIFTY trade ideas
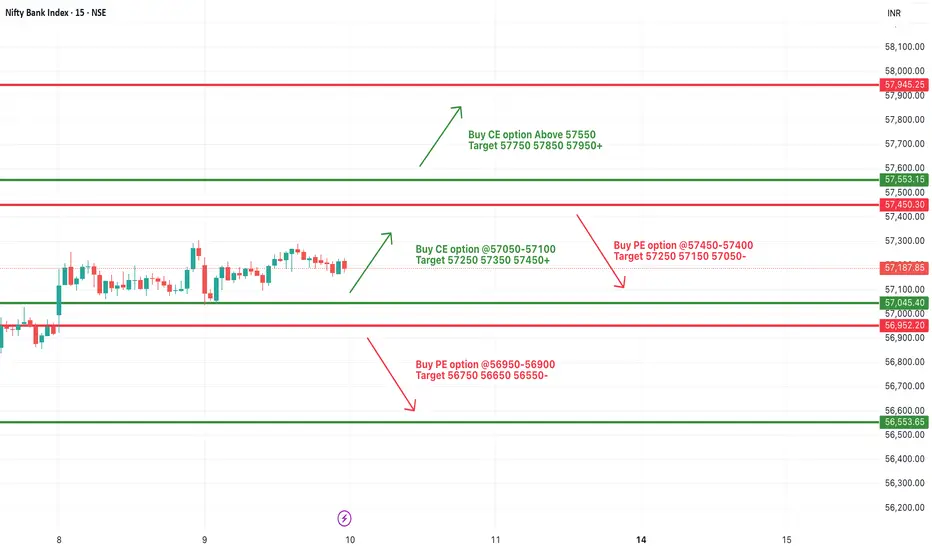
[INTRADAY] #BANKNIFTY PE & CE Levels(10/07/2025)Bank Nifty is expected to open flat today due to the continued consolidation seen over the last few sessions. The index is trading within a tight range between 57450 on the upside and 57050 on the downside, indicating indecision in the market.
A sustain above the 57050–57100 zone could initiate fresh buying momentum, potentially pushing prices towards the targets of 57250, 57350, and 57450+. Sustained move above 57550 may further lead to an extended rally toward 57750, 57850, and even 57950+ levels.
On the other hand, if the index breaks below the 56950–56900 level, it may invite fresh selling pressure. In such a scenario, downside targets are seen at 56750, 56650, and 56550-.
Until a decisive move happens beyond the upper or lower bounds, expect sideways action within the current consolidation range. Traders are advised to wait for a breakout from the range for directional trades.
BankNifty levels - Jul 10, 2025Utilizing the support and resistance levels of BankNifty, along with the 5-minute timeframe candlesticks and VWAP, can enhance the precision of trade entries and exits on or near these levels. It is crucial to recognize that these levels are not static, and they undergo alterations as market dynamics evolve.
The dashed lines on the chart indicate the reaction levels, serving as additional points of significance. Furthermore, take note of the response at the levels of the High, Low, and Close values from the day prior.
We trust that this information proves valuable to you.
* If you found the idea appealing, kindly tap the Boost icon located below the chart. We encourage you to share your thoughts and comments regarding it.
Wishing you successful trading endeavors!

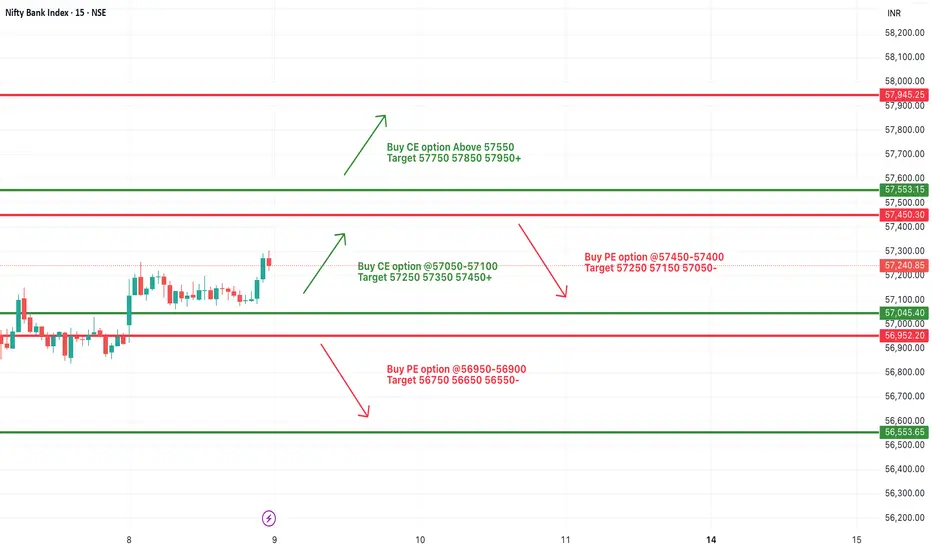
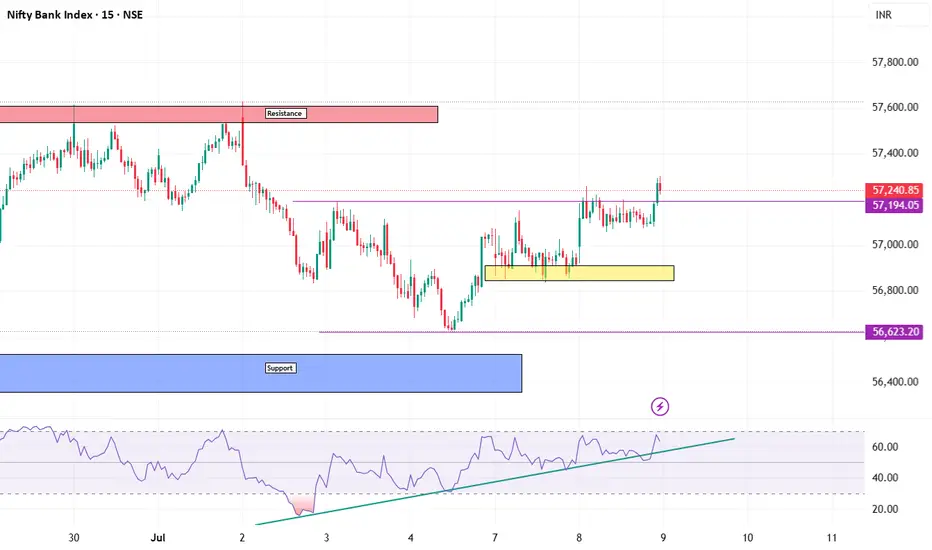
[INTRADAY] #BANKNIFTY PE & CE Levels(09/07/2025)Bank Nifty is expected to open slightly gap up today near the 57200-57250 zone, indicating mild bullish sentiment carrying over from the previous session. The index has broken out of the tight consolidation range and now approaches a key resistance near the 57400-57450 area.
A sustained move above 57550 could lead to a fresh upward rally toward 57750, 57850, and 57950+, supported by recent bullish momentum. However, if the index fails to sustain above 57400-57450, it may see a pullback, where traders should watch for possible selling pressure targeting 57250, 57150, and even 57050-.
If Bank Nifty drops below the 57100 level and especially under the 56950-56900 zone, it may turn bearish with potential downside targets at 56750, 56650, and 56550-. Overall, price action around the 57450 level will be key in defining intraday trend direction.
Banknifty chart analysis for tommorrowdosto
banknifty ka chart apko share kar raha hu jo apko kal ke liye help karega trading main.
aaj banknifty aur nifty dono ne hee ek breakout diaya.
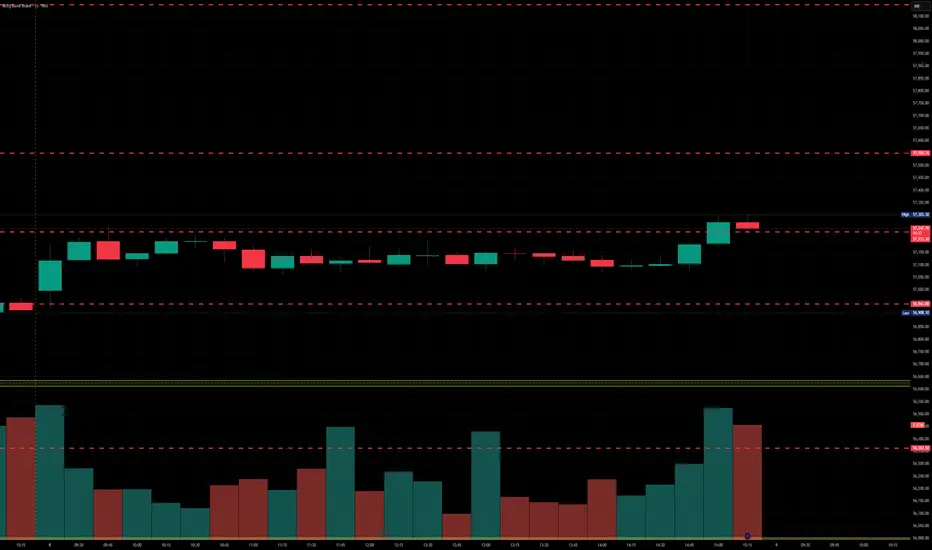
BankNifty levels - Jul 09, 2025Utilizing the support and resistance levels of BankNifty, along with the 5-minute timeframe candlesticks and VWAP, can enhance the precision of trade entries and exits on or near these levels. It is crucial to recognize that these levels are not static, and they undergo alterations as market dynamics evolve.
The dashed lines on the chart indicate the reaction levels, serving as additional points of significance. Furthermore, take note of the response at the levels of the High, Low, and Close values from the day prior.
We trust that this information proves valuable to you.
* If you found the idea appealing, kindly tap the Boost icon located below the chart. We encourage you to share your thoughts and comments regarding it.
Wishing you successful trading endeavors!
#Banknifty directions and levels for July 8th:if the market pulls back initially, we may see a minor pullback followed by some consolidation. This is my first variation (current view).
On the other hand, if the decline shows a solid structure and breaks the immediate support level, we can expect the correction to continue. If that happens, it could mark the beginning of a C wave or 3rd wave of the correction. This is my alternate view.

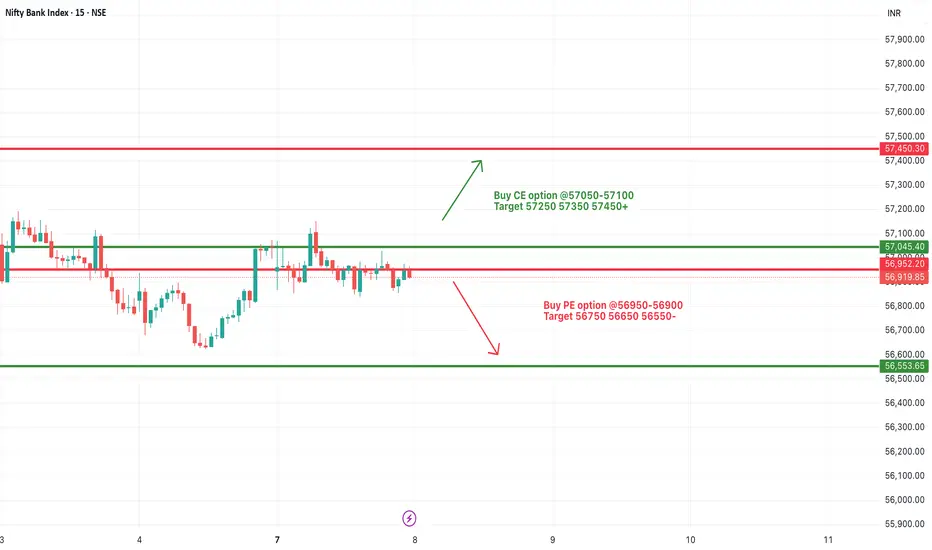
[INTRADAY] #BANKNIFTY PE & CE Levels(08/07/2025)Bank Nifty is expected to open flat with no significant change in levels compared to the previous session. The price action continues to remain within a consolidation range between 56950 and 57050. A breakout above the 57050 level could trigger bullish momentum, with potential upside targets at 57250, 57350, and 57450+. This resistance zone has been tested multiple times, and a clean breakout could attract fresh buying interest.
On the other hand, if Bank Nifty slips below the 56950–56900 support zone, it may lead to fresh selling pressure. In that case, we may see targets of 56750, 56650, and 56550 being achieved on the downside.
Since the market is currently range-bound and trading near the breakout/breakdown zones, traders are advised to stay cautious and wait for a confirmed move above 57050 or below 56950 for directional trades. Risk management is key, especially in this narrow consolidation phase.
BankNifty levels - Jul 08, 2025Utilizing the support and resistance levels of BankNifty, along with the 5-minute timeframe candlesticks and VWAP, can enhance the precision of trade entries and exits on or near these levels. It is crucial to recognize that these levels are not static, and they undergo alterations as market dynamics evolve.
The dashed lines on the chart indicate the reaction levels, serving as additional points of significance. Furthermore, take note of the response at the levels of the High, Low, and Close values from the day prior.
We trust that this information proves valuable to you.
* If you found the idea appealing, kindly tap the Boost icon located below the chart. We encourage you to share your thoughts and comments regarding it.
Wishing you successful trading endeavors!

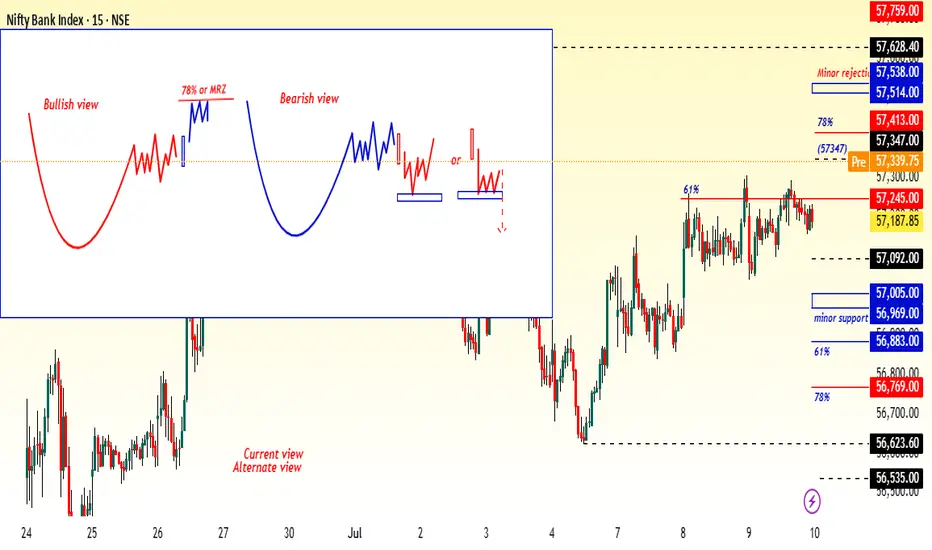
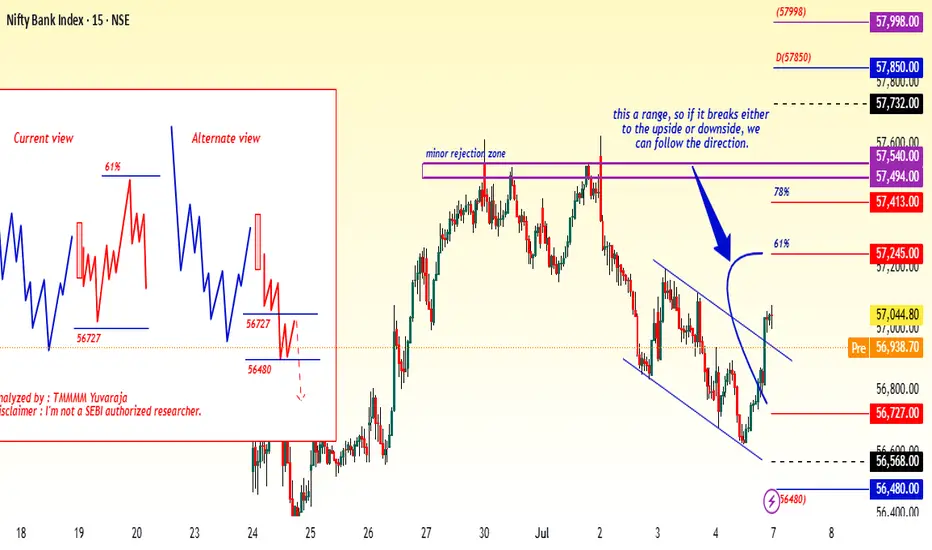
#Banknifty directions and levels for July 7th: as per the wave theory, the pullback is a three-wave structure, so I'm expecting some consolidation within the range. This is my first variation (current view). On the other hand, if the decline has a solid structure and breaks the immediate support level, we can expect correction continuation. If this happens, then it could be a C or 3rd wave of the correction. This is my alternate view.
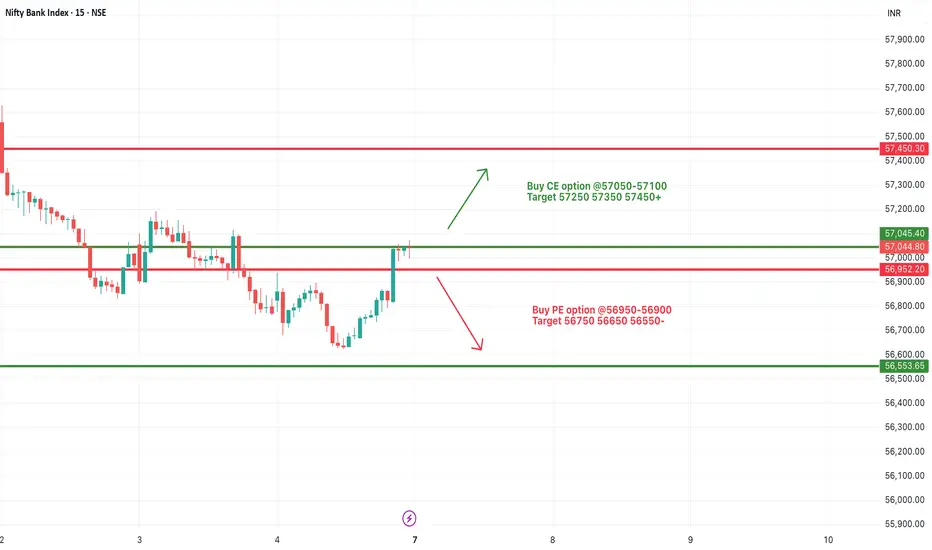
[INTRADAY] #BANKNIFTY PE & CE Levels(07/07/2025)Bank Nifty is expected to open flat near the 57000 mark, which coincides with a crucial resistance level. If the index manages to sustain above the 57050–57100 zone, it may trigger bullish momentum, pushing prices toward immediate targets of 57250, 57350, and potentially 57450+. This breakout zone holds significance as it marks a clear shift in sentiment from recent downtrends to potential reversal.
On the downside, if Bank Nifty faces rejection from current levels and slips below the 56900–56950 zone, it may indicate fresh weakness. In such a scenario, we can expect downward movement with targets at 56750, 56650, and 56550. The 56900 level will act as a short-term support, and a breakdown below it may resume the bearish momentum from the past sessions.
Traders should be cautious near the 57000–57050 zone and wait for a clear directional move. Whichever side breaks first, the movement is likely to gain momentum, so manage positions with strict stop losses and partial booking at each target.
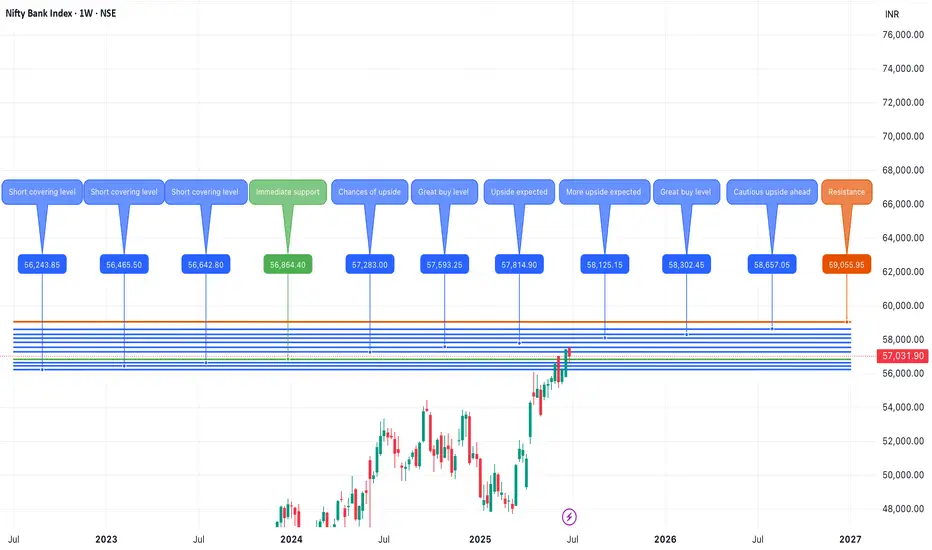
Banknifty July 2nd Week AnalysisBanknifty is looking neutral for the upcoming week , not looking very action-packed week for Banknifty and it can remain subdued with positive bias. While on the upside, if Banknifty crosses and sustains above 57600, then it can form new all-time highs upto 59000 levels . And on the downside, if Banknifty breaches 56800, then we can expect a small retracement upto 56500-200.
ALL LEVELS ARE MARKED IN THE CHART POSTED.
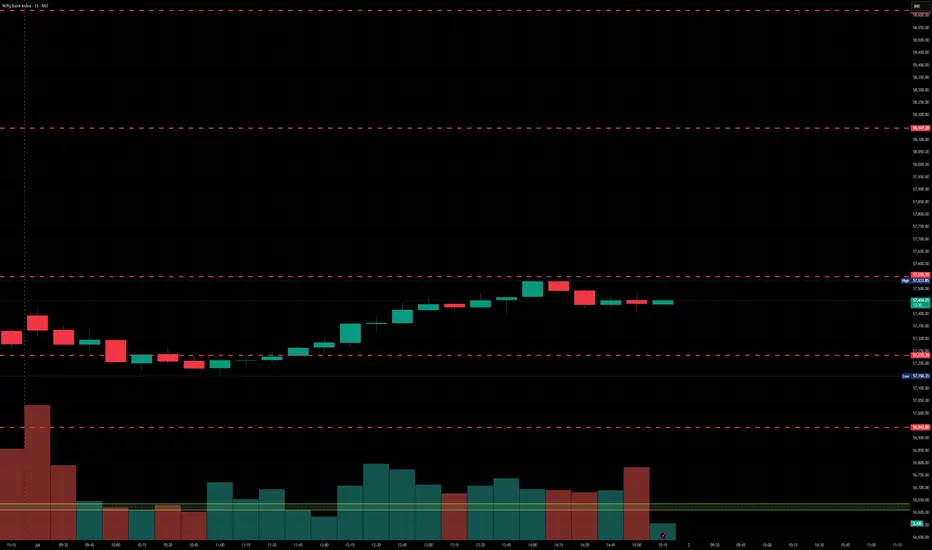
BankNifty levels - Jul 07, 2025Utilizing the support and resistance levels of BankNifty, along with the 5-minute timeframe candlesticks and VWAP, can enhance the precision of trade entries and exits on or near these levels. It is crucial to recognize that these levels are not static, and they undergo alterations as market dynamics evolve.
The dashed lines on the chart indicate the reaction levels, serving as additional points of significance. Furthermore, take note of the response at the levels of the High, Low, and Close values from the day prior.
We trust that this information proves valuable to you.
* If you found the idea appealing, kindly tap the Boost icon located below the chart. We encourage you to share your thoughts and comments regarding it.
Wishing you successful trading endeavors!

[INTRADAY] #BANKNIFTY PE & CE Levels(04/07/2025)Bank Nifty will open with a gap-up near the 56950 zone, placing it close to an immediate resistance area. If the index sustains above the 57050–57100 level, it indicates bullish strength and could trigger a further upward move toward 57250, 57350, and potentially 57450+. This level acts as a breakout zone for upside momentum. On the other hand, if the price faces resistance around 56950–57000 and starts reversing, a short opportunity opens below 56950–56900, with targets placed at 56750, 56650, and 56550.
In case Bank Nifty falls further and breaches the 56450 mark, it may signal a strong breakdown and continuation of the downtrend, leading to lower targets around 56250, 56150, and 56050. However, if the index takes support at the 56650–56600 zone and shows signs of reversal, it can provide a buying opportunity for a bounce back toward 56750, 56850, and 56950.
Overall, the day’s strategy should be reactive to these key levels, with trades initiated only upon proper price action confirmation. Use trailing stop-loss to protect profits and exit partially at key target levels.

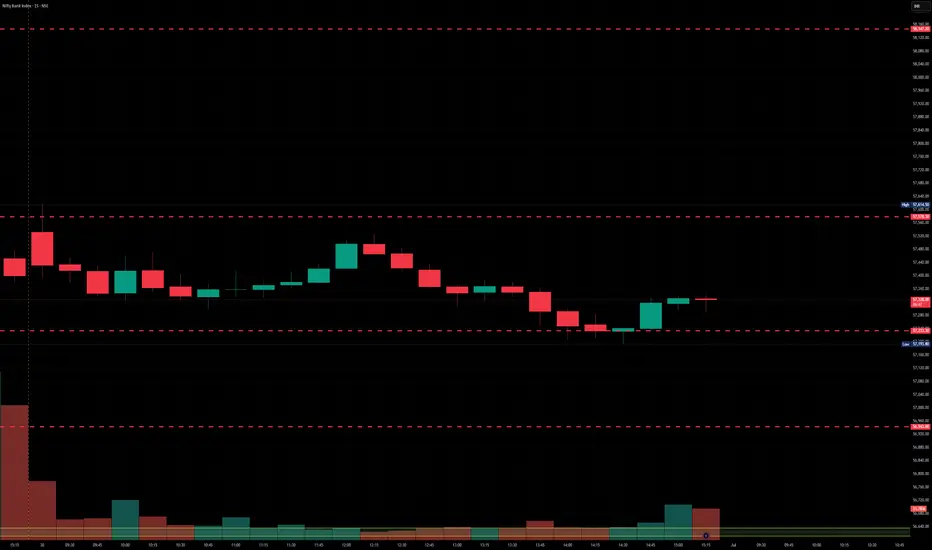
BankNifty levels - Jul 04, 2025Utilizing the support and resistance levels of BankNifty, along with the 5-minute timeframe candlesticks and VWAP, can enhance the precision of trade entries and exits on or near these levels. It is crucial to recognize that these levels are not static, and they undergo alterations as market dynamics evolve.
The dashed lines on the chart indicate the reaction levels, serving as additional points of significance. Furthermore, take note of the response at the levels of the High, Low, and Close values from the day prior.
We trust that this information proves valuable to you.
* If you found the idea appealing, kindly tap the Boost icon located below the chart. We encourage you to share your thoughts and comments regarding it.
Wishing you successful trading endeavors!

[INTRADAY] #BANKNIFTY PE & CE Levels(03/07/2025)Bank Nifty is expected to open flat near the 56,970 level. After a strong downward move in the previous session, prices are attempting to recover from the 56,950 support zone. This level may act as an immediate base in early trading hours.
If Bank Nifty sustains above 57,000–57,045 levels, we may see a short covering rally toward 57,250–57,450. However, any rejection near 57,000 can again drag the index toward 56,750 and 56,550. Since the price is opening near a key decision zone, it's advised to wait for directional confirmation before entering any trade.

BankNifty levels - Jul 03, 2025Utilizing the support and resistance levels of BankNifty, along with the 5-minute timeframe candlesticks and VWAP, can enhance the precision of trade entries and exits on or near these levels. It is crucial to recognize that these levels are not static, and they undergo alterations as market dynamics evolve.
The dashed lines on the chart indicate the reaction levels, serving as additional points of significance. Furthermore, take note of the response at the levels of the High, Low, and Close values from the day prior.
We trust that this information proves valuable to you.
* If you found the idea appealing, kindly tap the Boost icon located below the chart. We encourage you to share your thoughts and comments regarding it.
Wishing you successful trading endeavors!

[INTRADAY] #BANKNIFTY PE & CE Levels(02/07/2025)Bank Nifty is expected to open flat near the 57,440 level, just below the immediate resistance at 57,450. This zone will play a crucial role in today’s session. Sustaining above 57,450 can lead to bullish momentum with potential upside targets of 57,550, 57,850, and 57,950. Traders may look for a breakout confirmation before entering long trades.
On the downside, if the index fails to sustain above the 57,450 level and reverses, support around the 57,100–57,050 zone could be tested. A move below this range might lead to a short-term decline toward 57,000 and 56,950. The market remains in a consolidation phase, and breakout from this tight zone can lead to a directional move.

BankNifty levels - Jul 02, 2025Utilizing the support and resistance levels of BankNifty, along with the 5-minute timeframe candlesticks and VWAP, can enhance the precision of trade entries and exits on or near these levels. It is crucial to recognize that these levels are not static, and they undergo alterations as market dynamics evolve.
The dashed lines on the chart indicate the reaction levels, serving as additional points of significance. Furthermore, take note of the response at the levels of the High, Low, and Close values from the day prior.
We trust that this information proves valuable to you.
* If you found the idea appealing, kindly tap the Boost icon located below the chart. We encourage you to share your thoughts and comments regarding it.
Wishing you successful trading endeavors!
[INTRADAY] #BANKNIFTY PE & CE Levels(01/07/2025)Bank Nifty is expected to open slightly gap up near the 57,450 level, which lies close to an important resistance zone. If the index manages to sustain above this level, a further upside movement may be seen toward 57,750, 57,850, and 57,950. Strength above 57,500 could indicate bullish momentum continuation and may attract fresh buying interest.
On the flip side, if Bank Nifty fails to hold above the 57,450–57,400 zone and shows signs of reversal, a decline toward 57,250, 57,150, and 57,050 is possible. A breakdown below 56,950 will likely trigger further downside levels toward 56,750, 56,650, and 56,550. It is advised to observe price action around the 57,450–57,500 level for directional clarity in today’s session.

BankNifty levels - Jul 01, 2025Utilizing the support and resistance levels of BankNifty, along with the 5-minute timeframe candlesticks and VWAP, can enhance the precision of trade entries and exits on or near these levels. It is crucial to recognize that these levels are not static, and they undergo alterations as market dynamics evolve.
The dashed lines on the chart indicate the reaction levels, serving as additional points of significance. Furthermore, take note of the response at the levels of the High, Low, and Close values from the day prior.
We trust that this information proves valuable to you.
* If you found the idea appealing, kindly tap the Boost icon located below the chart. We encourage you to share your thoughts and comments regarding it.
Wishing you successful trading endeavors!
[INTRADAY] #BANKNIFTY PE & CE Levels(30/06/2025)Bank Nifty is expected to open on a flat note near the 57,400 zone, with price action currently hovering around a key resistance level of 57,450. If Bank Nifty sustains and breaks above this resistance zone of 57,450–57,500, a bullish breakout is likely. Traders can consider buying CE options in the 57,550–57,600 range with potential targets at 57,750, 57,850, and 57,950+. This move would signal continued upward momentum in the index.
However, if the price faces rejection from this resistance and slips below 57,450, a short-term reversal is possible. In that case, traders may look for PE opportunities in the 57,400–57,450 zone with targets at 57,250, 57,150, and 57,050. The lower support level remains around 57,050, which should act as a key zone for reversal or bounce-back scenarios.

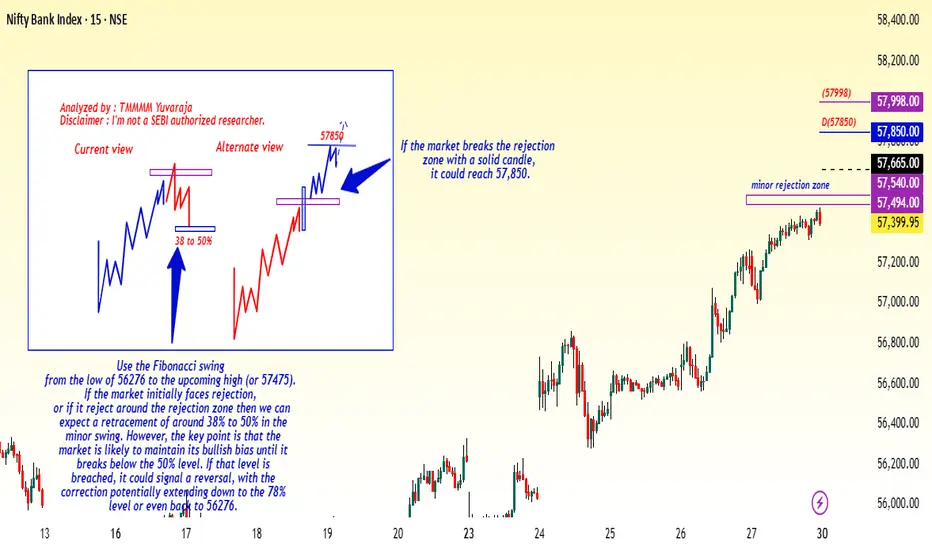
#Banknifty directions and levels for June 30The structures are still the same as what we saw in Friday’s session. We are currently in a minor consolidation zone, so if the market faces rejection near the immediate resistance, we can expect a retracement of around 38% to 50% in the minor swing.
On the other hand, if the market breaks the immediate resistance with a solid structure, then it could reach the next resistance level with the strong bullish bias.