BANKNIFTYBanknifty levels are based on imbalances
1. gapup 49650 long
2. 49650-49450 trade breakout
3. gapdown 49450 short
BANKNIFTY1! trade ideas

Review and plan for 3rd February 2025Nifty future and banknifty future analysis and intraday plan.
Budget effect.
This video is for information/education purpose only. you are 100% responsible for any actions you take by reading/viewing this post.
please consult your financial advisor before taking any action.
----Vinaykumar hiremath, CMT

BANKNIFTYBanknifty levels are based on imbalances
1. gapup 50300 long
2. 50300-49600 trade breakout
3. gapdown 49600 short
BANKNIFTY FUT SEEMS NEGATIVEHello All,
I am Back with one of Important Idea that too just before of Budget.
Idea is on BankNifty Fut.
As past few days market has given some relief and price moved up by approx. 4%.
But........
As per my opinion, BankNifty has not turned Positive yet.
BankNifty Fut: Daily Timeframe
CMP: 49,862.00
Support: 48,600.00 - 48,100.00
Resistance: 49,900.00 - 50,200.00
Important Factor: Bullish Divergence between : 13th to 27th Jan, 2025.
- Because of that Bullish Divergence BankNifty gained almost 1,900.00 points from bottom.
Here is the catch, after gaining 1,900.00 points even RSI is still below 50 Mark line.
Assumption: I feel Price has absorbed effect of Bullish Divergence and ready to free fall.
Target 1: 48,600.00 - 48,100.00 (at 1st support zone)
Target 2: 46,500.00 - 46,200.00 (at 2nd support zone)
Disclaimer: This script is solely my attempt to predict BankNifty based on my analysis. It is not intended as financial advice, and I am not asking anyone to trade based on this information. Trading involves substantial risk and is not suitable for every investor. Always conduct your own research and consult with a financial advisor before making any trading decisions.

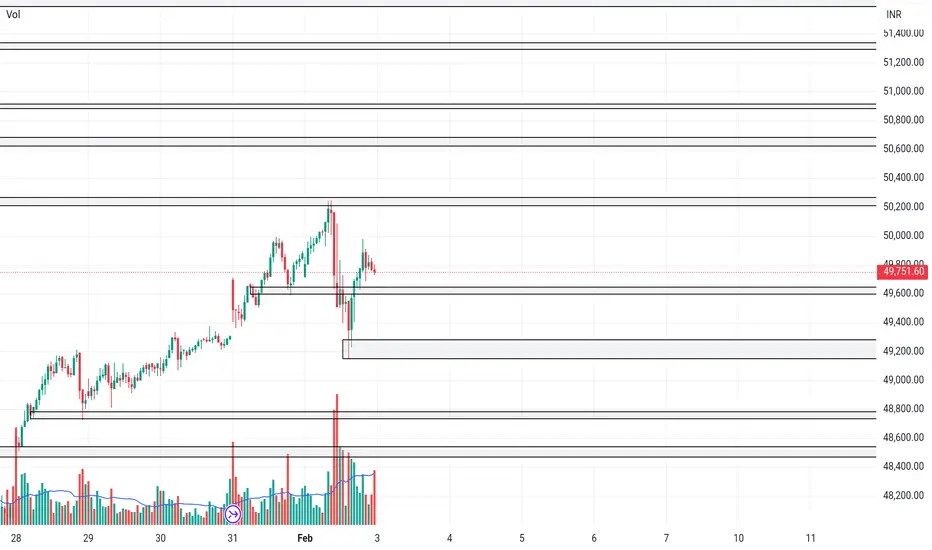
BANKNIFTYBanknifty levels are based on imbalances
1. gapup 50000 long
2. 50000-49600 trade breakout
3. gapdown 49600 short
BANKNIFTYBanknifty levels are based on imbalances
1. gapup 49350 long
2. 49350-49100 trade breakout
3. gapdown 49100 short
for orderflow trading message

Plan for 30th January 2025Nifty future and banknifty future analysis and intraday plan.
This video is for information/education purpose only. you are 100% responsible for any actions you take by reading/viewing this post.
please consult your financial advisor before taking any action.
----Vinaykumar hiremath, CMT

BANKNIFTYBanknifty levels are based on imbalances
1. gapup 49300 long
2. 49300-48800 trade reversal
3. gapdown 48800 short
to learn orderflow trading message

BANKNIFTYBanknifty levels are based on imbalances
1. gapup 48900 long
2. 48900-48500 trade breakout
3. gapdown 48500 short

BANKNIFTYBanknifty levels are based on imbalances
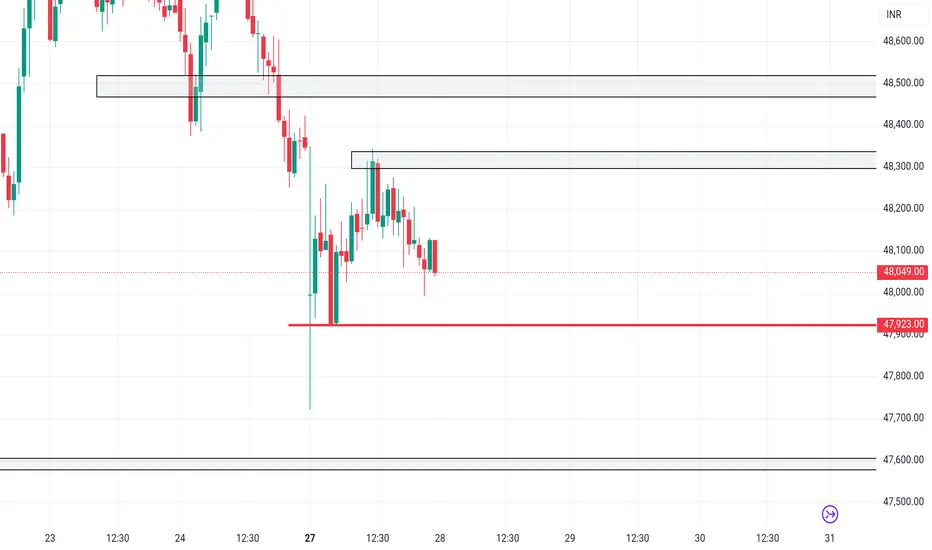
1. gapup 48350 long
2. 48350-47900 trade breakout
3. gapdown 47900 short
Time for BankNifty reversal BankNifty is currently at monthly FVG, but it will be ideal if we get a fake out towards the bottom, And T1 can be 50% of the range. NSE:BANKNIFTY1!

25-JAN-2025 BANK NIFTYCNXPSUBANK (More Weaker Than BANK NIFTY) Trading below 2025 Election Candle
NIFTYPVTBANK Similar to BANKNIFTY
HDFCBANK , ICICIBANK , KOTAKBANK Similar to BANKNIFTY
AXIS BANK WEAKER TRADING BELOW ELECTION 2024 CANDLE, INDUSINDBK more Weaker than AXIS BANK

BANKNIFTYBanknifty levels are based on imbalances
1. gapup 48500 long
2. 48500-48000 trade breakout
3. gapdown 48000 short

BANKNIFTYBanknifty levels are based on imbalances
1. gapup 49000 long
\2. 49000-48000 trade reversal
3. gapdown 48000 short

BANKNIFTYBanknifty levels are based on imbalances
1. gapup 49000 long
2. 49000-48400 trade reversal
3. gapdown 48000 short

banknifty bullsih in lower tf 15-30 minlong opportunity from this zone as it's clearly seen that new higher high has been already made here in 15 min

Plan for 22nd January 2025Nifty future and banknifty future analysis and intraday plan in kannada.
Positional trading ideas included.
This video is for information/education purpose only. you are 100% responsible for any actions you take by reading/viewing this post.
please consult your financial advisor before taking any action.
----Vinaykumar hiremath, CMT

BANKNIFTYBanknifty levels are based on imbalances
1. gapup 49300 long
2. 49300-48600 trade breakout
3. gapdown 48600 short

BANKNIFTYBanknifty levels are based on imbalances
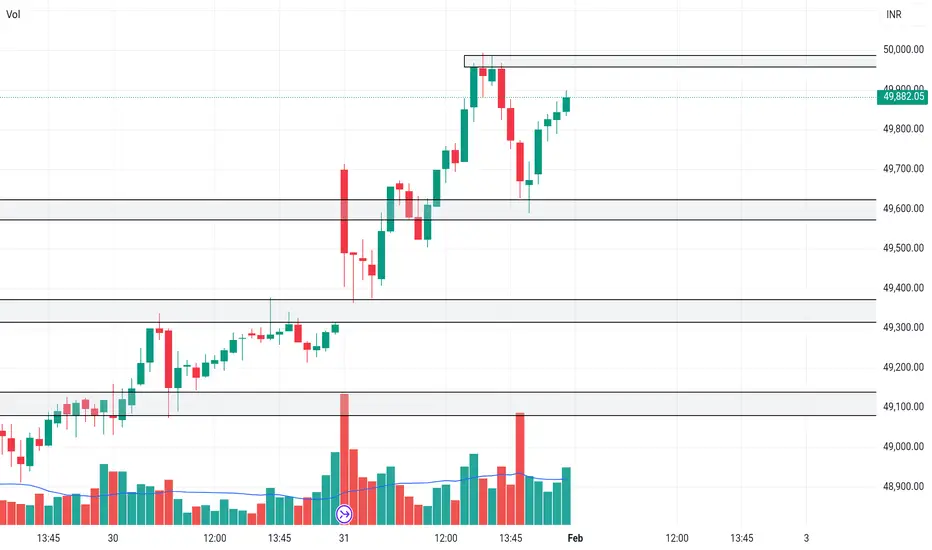
1. gapup 49900 long
2. 49900-49200 trade breakout
3. gapdown 49200 short

BANKNIFTYBanknifty levels are based on imbalances
1. gapup 48750 long
2. 48750-48200 trade breakout
3. gapdown 48200 short

BANKNIFTYBanknifty levels are based on imbalances
1. gapup 49650 long
2. 49650-49300 trade breakout
3. gapdown 49300 short

BANKNIFTYBanknifty levels are based on imbalances
1. gapup 49200 long
2. 49200-48600 trade breakout
3. gapdown 48600 short

Review and plan for 15th January 2025Nifty future and banknifty future analysis and intraday plan.
This video is for information/education purpose only. you are 100% responsible for any actions you take by reading/viewing this post.
please consult your financial advisor before taking any action.
----Vinaykumar hiremath, CMT
