basf--buywas recommended at 1400-1500 level now 3500. we are heading toward our target of 4083-4200. This MNC stock has a high book value of 677 and is a bonus candidate and EPS of 120-30 annualised .Dividend payout has been increasing and is only 9% now it looks company might increase dividend also. Buy as 5th wave target can increase on extentions as marked in chart.
BASF trade ideas

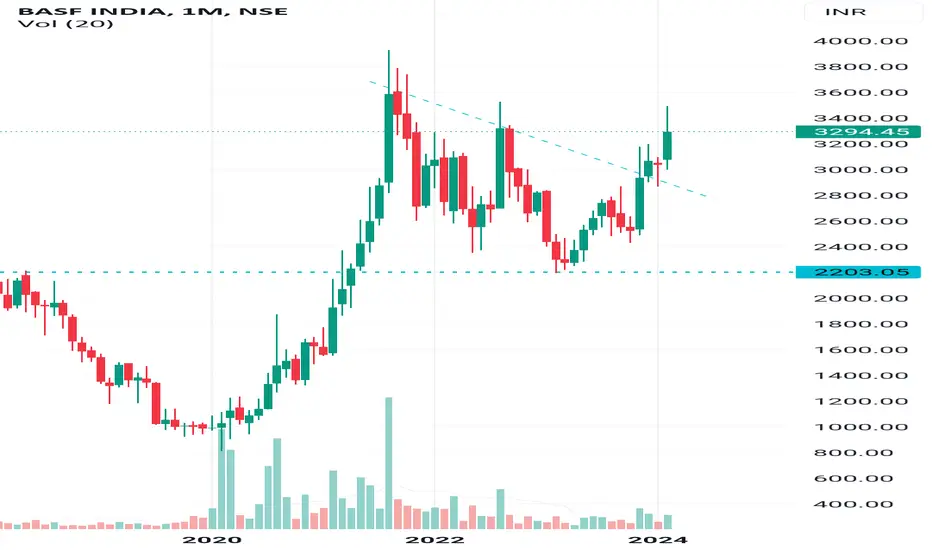
BASFBullish wedge flag breakout & retest done, now price is pushing upwards.
Disclaimer: Intended for educational purpose only and it's not a buy or sell recommendation.

BASF INDIA Bullish, Kindly do your own studyThis stock is ready for fire. Hence, don't play with fire.
In monthly chart looks like ABC correction is over and Price is challenged upper bollinger band.
Monthly MACD has just given PCO
Monthly RSI is near 60
Weekly price is just at resistance and there is a shakeout candle.
Weekly RSI is above 60
Weekly ADX is strong
Volume is good and EMAS PCO

BASFIn the Weekly Chart of BASF ,
we can see that, it is at a Decision making space.
It has created a Spinning Bottom Candle or we can say Decision Making Candle.
Lets see, whether it take a upward momentum or breaks down and take support of lower level.
KEEP A WATCH FOR GOOD TRADE.

BASF--BUY LONGSBASF has given good result in june 22 and sept 22 results are to be announced on 10th nov. moving averages 10 SMA- 2819 , 20 SMA- 2835 . 200 SMA 2836. Public float of 17.50 % . Won sales tax case of 750 Cr approx in high court. 1st wave top 3500 and 2nd wave correction looks complete at 2725 once crosses moving averages of 2840 you will see real power . I have a target of 4500 as per fibo ext .Buy at current price for long term porfolio building.

BASF--buy longBASF- is a strong buy company continuously giving good result and bumper result expected on 10th Nov 22. Buy for a 3rd wave target of 4550 . accumulate on every dip.

BASF - positional long ideaStock gave a breakout from downward sloping line. Chart pattern has potential to reach 3050-3100 in short to medium term. Keep a stop loss below 2650 in this trade.
Good luck.


BASF INDIA (LONG)BASF India took support at 255 EMA and Bounced Back
Now above 200 EMA
BUY 2700 - 2800
TGT 2932 - 3255 - 3390 -3534 - 3700
SL 2590
Please Correlate by yourself also on charts. This is for Educational and Paper Trading Purpose Only. Must Consult your financial advisor before Investing.


BASF AnalysisHi friends. This is my first analysis of BASF stock and i think as a swinging trader we should buy this @3280/3200, and our target should be @3700.

BASF analysis.Hi friends. This is my first analysis of BASF stock and i think as a swinging trader we should buy this @3280/3200, and our target should be @3700.


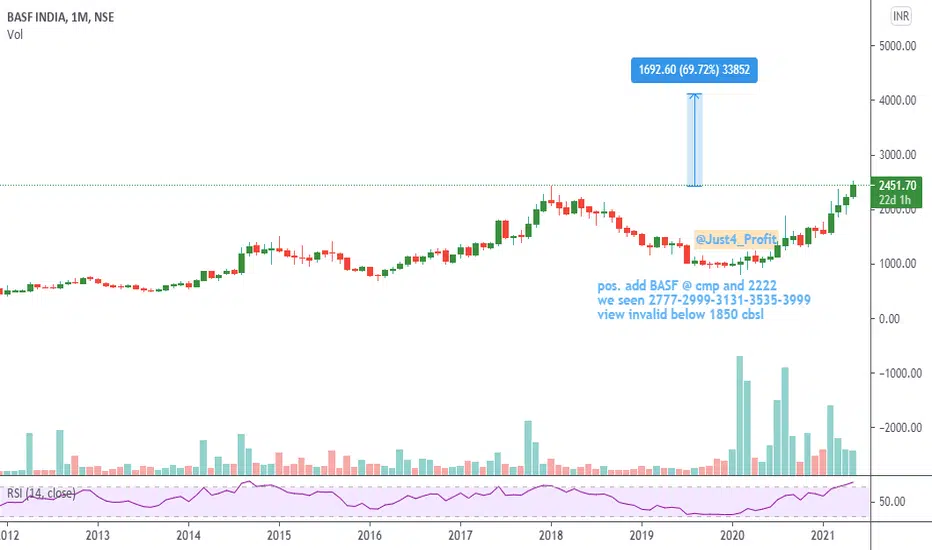
7 year old trendline breakoutThe stock have been bullish overall from year 2014, now last month it has given breakout from imp trendline and is retesting it. Good to go long for 25% in next 2-3 months, with sl 10%.


BASF breakout time to go for longGo for long as per Your setup with your risk to reward ratio.
Obey your own rules or you will lose more.


basf--compelling buyAFTER showing very good result BASF shares took a quantum jump from 1650 approx to 2000 rs.In the days to come fib extension is showing a price trg of 2510 to 2550 .

BASF - Buy for Long Cup and Handle formation on weekly chartCup and Handle formation on daily chart. Go long with 1 year horizon. 2400 target and once crosses lifetime high of 2456 -- This could double after that

