selling pressure till 115selling pressure till..115
after market sell slowly till 96
may be buying coming from115
but best level for buying is 95
..
BEL trade ideas

BELBEL
seems good to buy positional Cash
one can hold it with 97 Stop Loss
BEL100CE @2.61 with 2/- SL is good , Targets - 3.5/4.5/5.5/6.5
Above pink areas are reversal zones and targets


Next down move may start soonThe rise from 88 have been all corrective and can be marked an X wave.
Currently price is taking resistance at 20 Weekly SMA and upper end of the downward sloping channel.
One more up leg is not ruled out which may break the channel line temporarily.
We expect the next leg down to below levels may start post completion of the upmove
- 77 - 38.20% retracement of whole rise from 2020 lows
- 66 - 50% retracement levels.
Lets see how this develops.

BEL trying to ring the right bellsBharat Electronics is a Navratna PSU under the Ministry of Defence (Government of India). Company is also known as BEL. Company manufacture state of the art electronic product and system for the Army, Navy and the Air Force. CMP of the stock is 97.55. Negative aspect of the company is FIIs and MFs are decreasing stake. Positive aspects of the company are no debt, zero promoter pledge, improving annual net profit, and improving quarterly net profit. Entry in the stock can be taken after closing above 98.5 Target in the stock will be 103.9. Long term target in the company can be 110 and 114+. Stop Loss should be maintained at a closing below 87.

BEL : Ready Break the Trendline..!5 Step Analysis of BEL Stock
1. On Daily TF we can see the stock has break the trendline with high volume and give closing above trendline
2. Volatility and momentum build up on daily, weekly and monthly basis
3. Closing Given 20DMA above which is positive signal for stock
4.Short term trend is going positive
5. Stock will give closing above 98.3 then we can see at 102 levels in coming week.

#BEL AnalysisStock is maintaining its supportive trendline since long time in weekly TF, watch chart for support and target,


Going long with BELTrade Plan Long @ 101.35
SL 94.2
TP 109.55
bullish indications with multiple confluences.

BelBel a good pick for a momentum upmove trade
Pick from a defensive sector ahead of financial budget for the year 2023 stock have been trading in a range since few days and in last trading session it has made a good bullish hammer 🔨 on a daily time frame above 103 it can fire
Only for educational purposes
Ask your financial advisor before buying
Education: a hammer represent a bullish strength if pops near the demand zone

BEL , RANGE BREAK , 14 DAYSBel in range for 14 days 96 below and 100 on up side.
If 100.5 is broken can do 105 , 111,114 on upside.
If 96 is broken can do 93 , 91 , 83 on downside.

BELBEL CMP 100.80
Buy above 102
SL 95
Target 108/110/120
Swing/Positional
Looks good for short term.

BEL LONGBel in my radar
expecting pending order trigger soon
option trader wait for perfect confirmation swing can enter now
all levels shared here for educational purpose.we are not sebi registered

BEL Short Term Upside IdeaNSE:BEL is strongly sustained above major support of 106.
My idea is to take entry at level of 106.50 with stop loss of only 2.5 Points (SL 104). Will hold till targets of 110 & 119
Note: This is my personal analysis, only for learning. Thanks.

This stock is at a crucial level.Few things to look out,
1. Weekly Doji Candle. Next week closing will decide the momentum for this stock. I am inclined towards positive momentum. One weekly closing above 107.65 will ensure new uptrend.
2. Daily chart is also given. Fibonacci Retracement went just above 0.5 level. This indicates healthy retracement.
3. Major uptrend started from the gap which took place on Monday. Always look out for this type of gaps. If at all this level comes dont forget to bet on contra positions. Go long even if its downtrend.

How to find High Probability trades?Hi all, hope you guys are doing well.
In this post, we are going to see how we can combine different indicators/concepts to create confluence zones and find high-probability trades.
Introduction
A trade that has a greater chance of success than a regular trade is called a high-probability trade. Obviously, it's our assumption that some trades have higher chances of success as compared to others because they have more supporting factors. Nevertheless, a high probability trade can also result in a loss.
How to find high-probability trades?
There are a few things that you can observe to find a confluence of various important factors such as a support/resistance level, demand/ supply zone , Fibonacci level, moving averages, volume , RSI , etc.
Depending on your knowledge and trading style, the confluence zone can be derived using a combination of various different concepts or indicators. In this post, I am going to share the factors that I look at for finding good trades.
How to find confluence zones?
In order to find the confluence zones, you need to understand the concepts and the indicators, then combine them together to create the whole picture. It's like building a jigsaw puzzle - first, you need to identify the individual pieces, and then you need to put them together.
Let’s dive into all of these concepts one by one.
1. Market structure
Market structure is simply a basic form of understanding how the markets move. The price action is how the market moves based just on price, without the consideration of trends and how they may continue. But the market structure is focused mainly on the trend.
I have covered market structure in various different threads that you can read here:
a) Introduction to Market structure
b) Bullish market structure
c) Bearish market structure
2. Consolidation before Breakout
If a stock consolidates before giving a breakout, there are higher chances that it will be a true breakout. This is because all the residual supply gets absorbed at the resistance zone and most of the pending demand orders get filled.
Ideally, once a stock goes into consolidation, one of the two processes occurs:
Accumulation
Distribution
In layman’s terms,
- If demand is more aggressive than supply, then the price rallies, which confirms accumulation.
- Similarly, if the supply is more aggressive than the demand, then the price falls down, which confirms distribution.
If you are struggling with identifying the breakouts, be sure to read this post.
3. Support-Resistance levels
S/R levels are critical parts of trend analysis because they are used to highlight important zones. The fact that these levels flip roles between support and resistance can be used to determine the range of a market, trade reversals, bounces, or breakouts. These levels exist due to the influx of buyers and sellers at key junctures.
Flip zone acting as resistance:
Flip zone acting as support:
If you are looking for an in-depth tutorial on support and resistance, please check out my old guide here:
4. Supply-Demand zones
S/D demand zones are one of the most important things that I look at while charting. The stronger the S/D zone, the higher the chances of a reaction. Always look for these zones in the direction of the major trend.
5. Location of 200MA or 200EMA
Always observe the position of 200MA/ EMA with respect to price. Once the price interacts with the moving average, study the reaction. If you are looking for a long trade, then look for a positive reaction as the price reacts with the moving average.
6. Overlap with a Fibonacci level
A lot of times, the price will come back to a Fibonacci level. You need to observe the price behavior near these levels.
If you are not familiar with the Fibonacci tool, please check my old guide on Fibonacci retracement and extension.
7. Candlestick pattern and the size of the candles
The candle spread plays an important role in determining the strength and mood of the underlying trend. In layman's terms, big-bodied candles indicate strength and small-bodied candles act as noise.
In any case, the candlestick pattern and candle spread should only be viewed at an important level. The context plays a crucial role.
8. Chart patterns
This is pretty self-explanatory. If you trade patterns, you can combine them with other factors to strengthen your analysis.
9. Volume expansion
Ideally, at the time of the breakout, the volumes should rise. The volume can be deceiving and we need to see orderflow for a clear picture. Obviously, the majority of us are not looking at the orderflow and hence the volumes can be deceiving. But, for a normal trader, the simple volume indicator is more than enough.
So, these are mainly all of the factors that I look at while analyzing the charts. Please note that the usage of the concepts will vary with charts. Sometimes only 3-4 factors may be at play and the other times, 6-7.
High Probability trade checklist:
1. Market structure
2. Consolidation before the Breakout
3. Support-Resistance levels
4. Supply-Demand zones
5. Location of 200MA or 200EMA
6. Overlap with a Fibonacci level
7. Candlestick pattern and the size of candles
8. Chart pattern
9. Volume expansion
In the example above, you can notice the following things:
1. The market structure was bullish before the breakout, which was evident from the formation of higher highs and higher lows. Don't confuse the internal structure (Low time frame structure) with the external structure (High time frame structure).
2. The price was consolidating in the rectangle / parallel channel for a good amount of time.
3. When the price reached the previous demand zone, the selling pressure started to decrease and the buyers started to step in.
4. When the price interacted with 200MA/ EMA, there was a strong reaction to the upside. This means that the buyers want to take the price higher.
6. The buying interest can be seen by an increase in the volume in the last few sessions before the breakout. The volume can be deceiving and we need to see orderflow for a clear picture. But in general, you do not need to complicate this, just use volumes in conjunction with other factors.
7. We always look for some reversal or indecision candlesticks in the confluence zone. In the chart above, at the point of interaction with the moving average and the demand zone, we can see the formation of exhaustion candles.
Again, we need to look at these patterns only at specific important levels (like support or resistance levels) and disregard the formations in between the levels.
8. When the price broke above the previous major resistance with a massive bullish candle, there was a heavy volume expansion.
More examples:
You can read and revise this post until you understand all the concepts.
Thanks for reading. I hope you found this helpful! 😊
Disclaimer : This is NOT investment advice. This post is meant for learning purposes only. Invest your capital at your own risk.
Happy learning. Cheers!
Rajat Kumar Singh (@johntradingwick)
Community Manager (India), TradingView


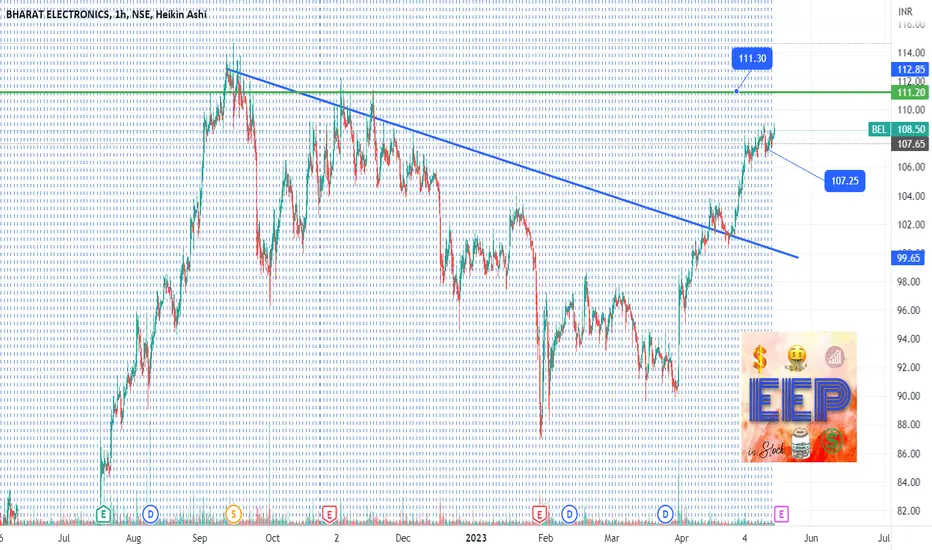
BEL might correctAfter good move it seems like ready for correction below 107 with sl of 111 with target of 100-93 in coming days


