BERGEPAINT at Best Support !!This is the Daily Chart of BERGEPAINT .
BERGEPAINT having good law of polarity at 540-545 range.
EMA is also providing support for the stock around the 545 range.
If this level is sustain the , We may see higher price in BERGEPAINT.
Thank You !!
BERGEPAINT trade ideas

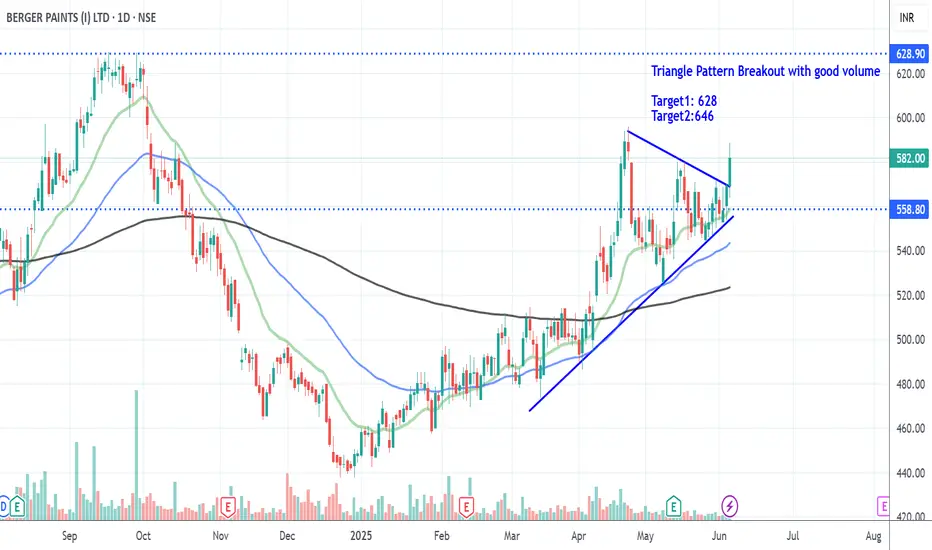
Berger Paint_Triangle pattern BreakoutExisting Trend: UpTrend
Triangle pattern Breakout with good volume
Can enter with right entry point. (When price tests 20 HEMA or 20 -15min EMA)
Disc: Educational Purpose only

Berger Paint CUP and Handle formation .. Good to BUY Berger Paints ( 568) is currently showing CUP and Handle pattern. It is undervalued ( fair value 780 ) and is available at discount of 200. It is maintaining a healthy dividend payout and 5 Years ROE @ 22%. Hence we find Berger Paints a good to have in portfolio which could give 30% return
bergerpaint we can go long on cmp 547/500 rangewe can go long bergrepaint cmp 547/500 range for the 1st imp target 680
one it hold 680 level we can see new high and next big target 1600++
because the abv 680 zone its ready break the 4 year of consolidation range so keep eye on this stock for the long term holding only
go long cmp 547-500
stoploss on 430
1st target on 680
2nd target - 1600+ ( once it break the 4 year of range break out then only our 2nd target we can plan)

Berger Paints at Make-or-Break Point:Descending Triangle PatternBerger Paints is currently testing the upper boundary of a long-term Descending Triangle on the weekly chart — a pattern known for sharp breakouts or breakdowns.
📊 Resistance Zone: 600 – A breakout above this level could trigger a powerful upside rally towards 825+, supported by the pattern's height projection.
🔻 Support Level: 543 – A breakdown below this level may lead to a sharp fall towards 400 levels.
⚠️ Bearish Pin Bar Candle at resistance signals caution; confirmation is key before entering any trade.
📌 Watch closely for a decisive move – this zone is critical for trend reversal or continuation.
This setup offers a high-reward opportunity for positional traders, with clear entry and exit zones. Manage your risk wisely and follow with volume confirmation.

BERGEPAINT good to studyNSE:BERGEPAINT
Given Breakout of Range
Good to keep on the radar
Always respect SL & position sizing
========================
Trade Secrets By Pratik
========================
Disclaimer
NOT SEBI REGISTERED
This is our personal view and this analysis
is only for educational purposes
Please consult your advisor before
investing or trading
You are solely responsible for any decisions
you take on basis of our research.

Berger Paints**Berger Paints Analysis**
- **Time Frame:** Monthly
- **Setup:** Range Movement
The stock has been oscillating between 450 and 600-620 since February 2023. The setup appears favorable above 500, with a target of 600-620 and a stop loss (SL) at 434.
😊
Disclaimer: Study only for Educational Purpose.
Remember: My Money, My Risk, My Reward, My Responsibility.
Please Consult your SEBI registered Financial Advisor for any Financial Advice/ Decision.

Bergerpaint Support and resistance pointsBerger paints has been in Parallel channel since 2020 August between 450 to 660. I would be setting up stoploss at 450 and further buy at 700 to be safe

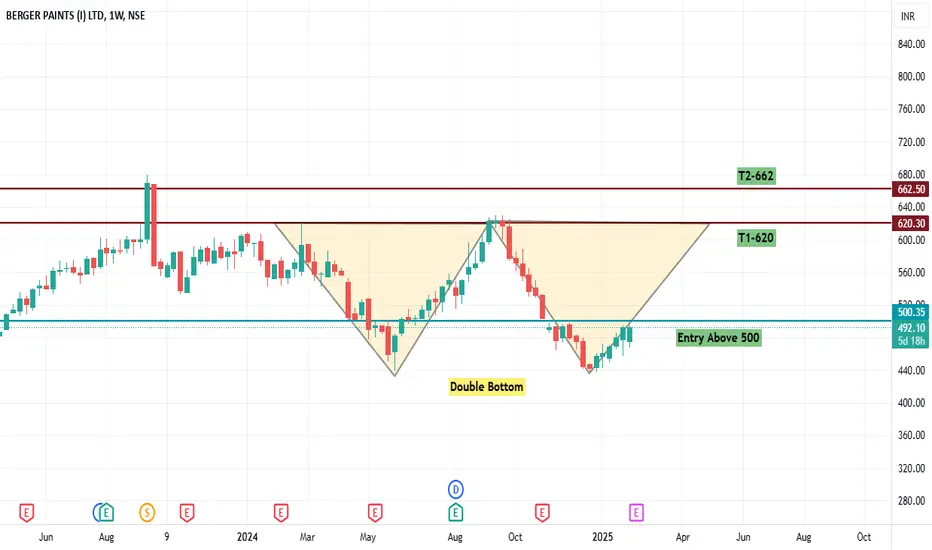
Berger Paints - Double Bottom in ProgressProgressive Double Bottom for Berger Paints
Breakout above 500 can give big targets to 620/662
BERGER PAINT LONGIn a weakish market Berger paint is showing strength. can be bought with a strict stop loss of 460

berger paints longrisk reward is decent. l
stock is taking support from this zone.
lets see if it goes up or breaks the support.
If it forms W pattern then probability will be high

BERGEPAINT : Going LongThe current net holding is approximately 1.875% of the net capital. I plan to increase the holding to 2.5% once the price reaches the channel's lower trendline.
📢📢📢 If my perspective changes or if I gather additional fundamental data that influences my views, I will provide updates accordingly.
Thank you for following along with this journey, and I remain committed to sharing insights and updates as my trading strategy evolves. As always, please feel free to reach out with any questions or comments.
Other posts related to this particular position and scrip, if any, will be attached underneath. Do check those out too.
Disclaimer: The analysis shared here is for informational purposes only and should not be considered as financial advice. Trading in all markets carries inherent risks, and past performance is not indicative of future results. It's essential to conduct your own research and assess your risk tolerance before making any investment decisions. The views expressed in this analysis are solely mine. It's important to note that I am not a SEBI registered analyst, so the analysis provided does not constitute formal investment advice under SEBI regulations.

Berger Paints Long setupHello,
Trend-Based Analysis. Buy the Dips, Sell The Rallies, Also Following the Trend. Let's see where the Price Action takes us, Riding the wave. Potential trade setups based on trend momentum.
Technical analysis based on trend identification and momentum, Looking for high-probability setups within the prevailing trend.
Analyzing the current market trend and potential future price movement. Focusing on risk management and reward-to-risk ratios.
Details is Mentioned in Chart, Read carefully.. .

Berger Paints short term analysisThe current market price of Berger paints appears reasonable, and the chart indicates a potential short-term trend reversal from the current price. In the short term, it could potentially reach 570-600. However, this view remains invalidated if Berger paints breaches 410.

BERGER PAINTS | Swing trade opportunity | 100% returnsBERGER PAINTS
Monthly time frame
Stock consolidating between 450 – 730 for the last 5 years
Stock has retested the support zone of the white parallel channel and looks good to touch the resistance of this channel
Stock riding above 20-, 50- & 200-month moving averages
RSI = 55, indicating build-up of bullish momentum
MACD crossover expected and is above the 0 line, indicating bullish momentum
Volumes have been good since May 2024, implies heavy buying
Weekly time frame
Breakout of the yellow trend line, retest done & bullish momentum established
Stock riding above 20-, 50- & 200-week moving averages
20WMA about to cross 50WMA and golden crossover also approaching
RSI > 60, indicating bullish momentum
MACD above the 0 line, indicating bullish momentum
Daily time frame
Breakout and retest of the yellow trend line clearly confirmed
Breakout of the blue resistance dotted trend line after 11 months
Stock in the process of making a higher high (Dow theory)
Breakout of the cup and handle pattern
Stock riding above 20-, 50- & 200-day moving averages
20DMA has crossed 200DMA, and golden crossover is also approaching
RSI > 65, indicating bullish momentum
MACD is well above the 0 line and in green zone, indicating solid momentum
Conclusion
Entry: 585
Stop Loss: 525
Target 1: 725
Target 2: 830
Target 3: 1070
Fundamentals
ROCE = 27.5% {Ideal > 15}
ROE = 23.5% {Ideal > 15}
Stock PE (58) = Industry PE (54) {Stock not overvalued}
Int Coverage = 22 {Ideal > 2}
CF Operations / EBIT = 0.98 {Ideal > 1}
Debt to equity = 0.14 {Ideal value < 1}
Promoter stake has remained consistent over the years > 74.99%

Berger from 2020 to 2024 in 4 years , I just got +6% profitcmp: 500 Nov 2024
Total invested : 198 qntty
94k/-
Unrealised profit : just +5k/-
from 2020 to 2024 in 4 years , I just got +6% profit

Buy Berger PaintsBerger Paints is the second largest paint company of India and a trusted brand in the market. It has given its best quarterly results and still the company is almost 27% down from its lifetime high. It is a good time to invest in the company. The company has reduced debt. The company has been maintaining a healthy dividend payout of 35.8%.
Please do your own analysis before investing.
Hope you learned something new from my ideas.
Do like, share and follow me. thank you!

BERGEPAINT NSE:BERGEPAINT
One Can Enter Now !
Or Wait for Retest of the Trendline (BO) !
Or wait For better R:R ratio !
Note :
1.One Can Go long with a Strict SL below the Trendline or Swing Low.
2. R:R ratio should be 1 :2 minimum
3. Plan as per your RISK appetite and Money Management.
Disclaimer : You are responsible for your Profits and loss, Shared for Educational purpose

Berger Paints (I) Ltd.*Berger Paints (I) Ltd.*
P&F on Decadal Basis.
*W* on Yearly Basis.
Strong upward Price BreakOut Sustained.
Strong Vol. Consolidation. Continued traction required.
RSI: 1H>D>W>M
EMAs: Widening Gaps amongst 20/ 50/ 100/ 200 on Monthly Basis.
*Trail SL with Upside*
*Book Profit as per Risk Appetite*
1) Stable / Falling Crude prices in light of Libyan/Iraq oil flow. Muted / Slowing Chinese economy leading to lower demand higher supply. This will be Margin Accretive for Crude based products manufacturers.
2) Increasing RE / Replacement demand additional+ve factor.
*This is an Opinion. Do Your Own Research.*
*_Happy Investing_*🤓

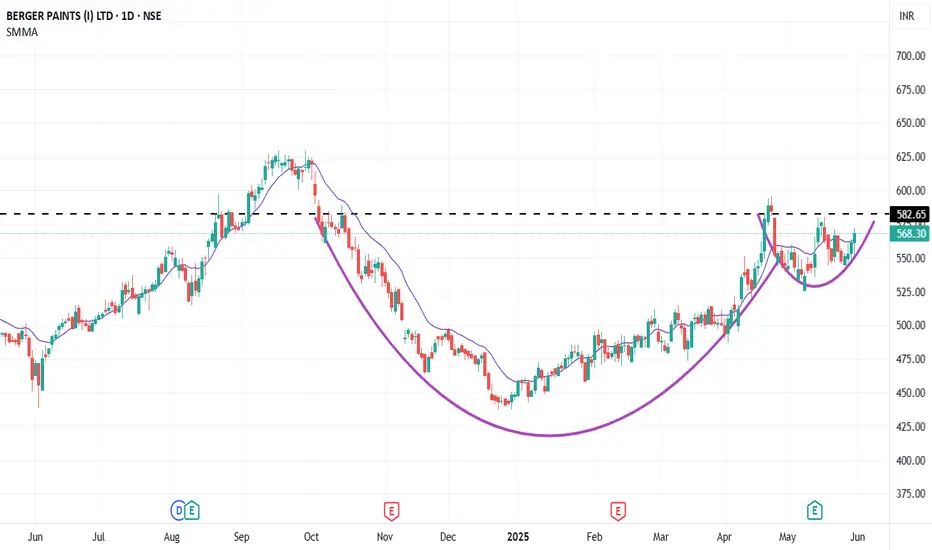
Positional Trade Setup for Berger Paints:The chart indicates a "Cup and Handle" pattern, which is a bullish continuation pattern. The price has formed a rounded bottom (the cup) and appears to be forming the handle, suggesting a potential breakout above the resistance level.
The stock is currently testing the resistance zone around 597-600 INR, which is a crucial breakout level for the completion of the pattern.
Volume Confirmation:
The breakout attempt is accompanied by increasing volume, which is a positive sign indicating strong buying interest. This volume confirmation supports the likelihood of a successful breakout.
Entry Point:
A good entry point would be on a confirmed breakout above 600 INR with strong volume, or on a pullback to the 590-600 INR range, provided the pullback is on lower volume, indicating consolidation rather than a reversal.
Stop Loss:
Place a stop loss below the handle low, around 570 INR, to protect against false breakouts or pullbacks that invalidate the pattern. This placement gives a buffer zone below the key support areas.
Targets:
The first target could be set around 650 INR, which is a calculated target based on the depth of the cup. A longer-term target can be set around 675-700 INR, aligning with previous highs and potential psychological levels.
Risk-Reward Ratio:
Aim for a risk-reward ratio of at least 1:2. With an entry near 600 INR and a stop loss at 570 INR, targeting 650 INR or higher provides a favorable setup.
Additional Considerations:
Watch for the RSI and other momentum indicators to ensure they are not in overbought territory when entering. A strong trend with momentum confirmation will enhance the trade setup.
Keep an eye on overall market conditions, as they can influence the performance of the stock.
Summary: Berger Paints is showing a promising Cup and Handle pattern with the potential for a breakout above the 600 INR level. A breakout with volume confirmation offers a good entry point for a positional trade targeting 650 INR and beyond, with a stop loss to manage risk below 570 INR. This setup presents a strong opportunity, provided market conditions remain favorable.

Berger Paints : Ready for 727Paint Industry is going through transformation and becoming more competitive. New players like Kotak engaged with with innovative business model and practices. All are bringing more value for the middle men and consumers alike. Like aviation companies, this is the only industry in the consumer goods space that has been struggling for uptick in the margins. Level playing filed is set now and these companies are ready for rebound.
Berger paints with strong financials showing strength in the stock price as well. Festive season is by the corner. This way there is an opportunity for a short term play.
Once close above 605, its is set for 727+
(SL 550)

BERGERPAINT, Cup and HandlePotential breakout from the cup and handle,
Target at 640, Stoploss at 515
Disclaimer : I am a aspiring swing trader, i have only started to learn to catch the pattern. So, please take this only as a idea
