BHARTIARTL trade ideas

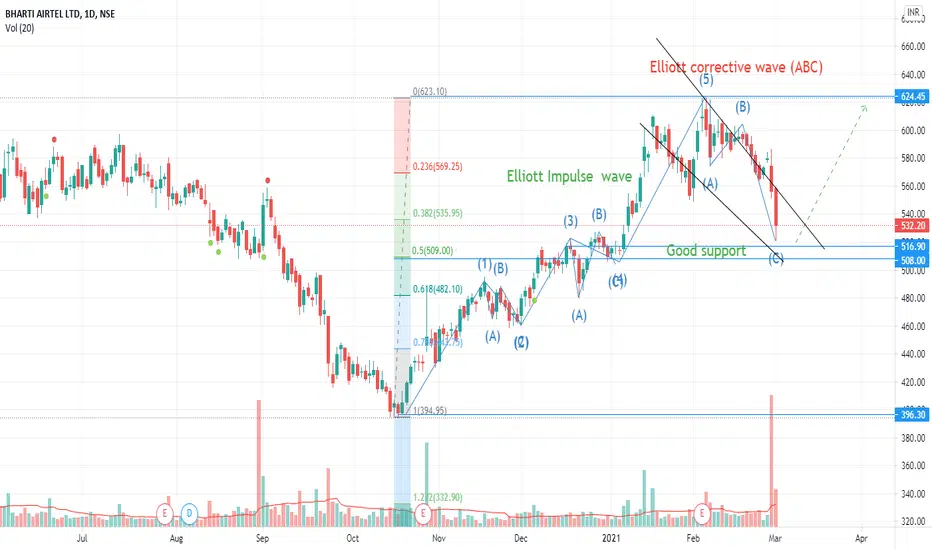
BHARTIARTL watch out 516 to 508 and go long!BHARTIARTL: First time I noticed Elliott Impulse wave and corrective wave! Looks like it is completing "corrective wave" and still there is place to go down to 516 to 508 where it can find good support! So watch out the price at 516 to 508 and then go long. Let's see how it works .


BHARTIARTL - on Long term trend lineOn Weekly timeframe BHARTIARTL is close to trend line
Add to watch list.
Trade with caution

BHARTI AIRTEL BULLISH VIEWBHARTI AIRTEL PRICE RESPECTING PARALLEL CHANEL AND BOUNCE SEEN FROM SUPPORT. ALSO HIDDEN BULLISH DIVERGENCE ON DAILY CHARTS SO PRICE MAY MOVE UPTO 623 IN FEW DAYS


Bharti AirtelBharti Airtel forming a symmetrical triangle pattern and everything mentioned in the chart.

Airtel chart based analysis
Airtel looks good for targets of 620 in next week. Breakout after proper consolidation may even result in higher targets of upto 650 within a month


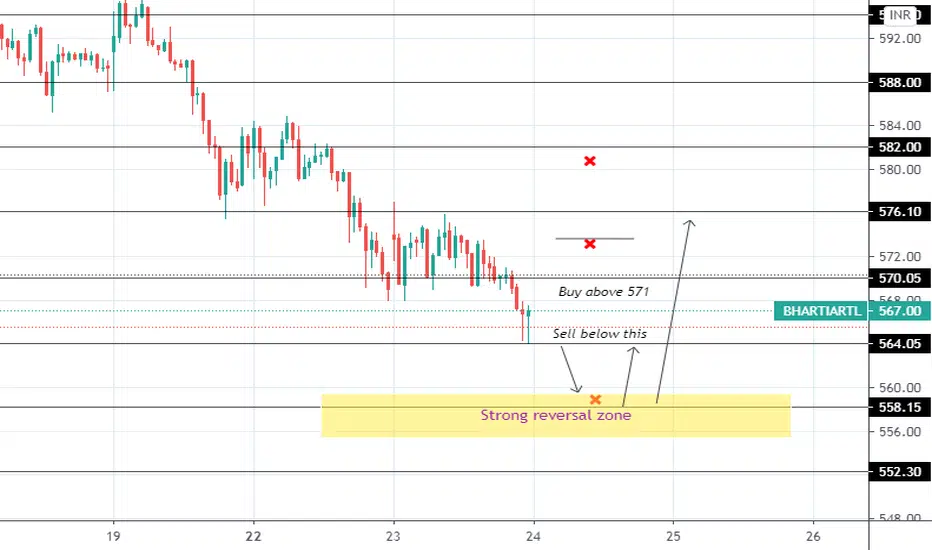
Bharti Airtel intraday 15th febLong and short opportunity shown.every support and resistance lines can be exit targets

Breakout in AirtelPrice coming from higher time frame demand zone and consolidation going from few days, now time for good Breakout in Airtel


Bhartiairtel to transcend UPit was a bad last two weeks preceding the last one for the stock , but a strong price action should take place since high significance at this level in the past was witnessed.


bullit can be open in down bt in every time frame it seems bullish i thinj after 9:30 we can think to buy for intraday when it comes to down what do u thimk about it guys

