BHARTIARTL trade ideas
Can we see ARTL breakout soonBuy BHARTIARTL around 520 levels target 580
In mid term expecting stock to hit 800 levles.

Airtel LongMarked are the potential reversal zones and we have 200 MA on daily timeframe as well.
Disclaimer:
Please note these are for educational purpose and in case if you trade, take as per your risk and financial advisor

BHARTI AIRTELNSE:BHARTIARTL
LEVELS HAVE BEEN MARKED, PLEASE REFER CHART, FEELING LAZY TO UPDATE
**********************************************************************************************************************************************
Hi all,
Its pleasure to have you all here.
I have started putting these charts as a contribution from my side to all people who are new to business, as I had to struggle a lot without any sources at disposal. So please consider this a just small contribution from my side.
Few Honest Disclosures:
1. Any idea shared is my personal view, its not a recommendation, neither any kind of paid propaganda, so please
do your bit of research.
2. Ideas shared does not mean that I trade all or have position in them, this is just a helping hand to all.
3. I expect no comments or like nor any negativity, as I said its just a small helping hand from my side, please plan your risk and trade as per your capacity.
4. To trade in Cash, options or futures is your sole choice and your own risk
5. I am no expert in Tech Indicators, I believe in support resistance and trendline theory, you may use this as a supplement theory for better results.
6. I work for my own living, this is a hobby which I do sincerely to help anyone who might come across my charts.
***********************************************************************************************************************************************


BHARTIARTL looks bullish to me.NSE:BHARTIARTL
BHARTIARTL Looks BULLISH on Daily chart.
To me BHARTIARTL looks bullish on daily chart. But Why??? read below given Simple no brainer view.
Area of 547-587 looks like area of re-accumulation after hitting a new lifetime high.
Now today on 13/08/2020 candle form right below the area of re-accumulation which was mention above, but candle not managed to close near the low which most of retailers were thinking of but its close in the middle and now may be confused with current scenario and still hoping BHARTIARTL to fall.
But ask one question to your self a question if there was really a that good supply in stock why its not mange to close near the low even after giving a breakdown to string support of 547.
DM if want know the answer you were asking to yourself..
Stop Finding Candle Stick Patterns Or Chart patterns simply focus on Price And Volume Only. Chart will Show you the Pattern you are looking for.
If view went good I will be looking for buying BHARTIARTL above 547 with SL below 520 both closing basis only on daily chart. Will hold this for Short term if activated


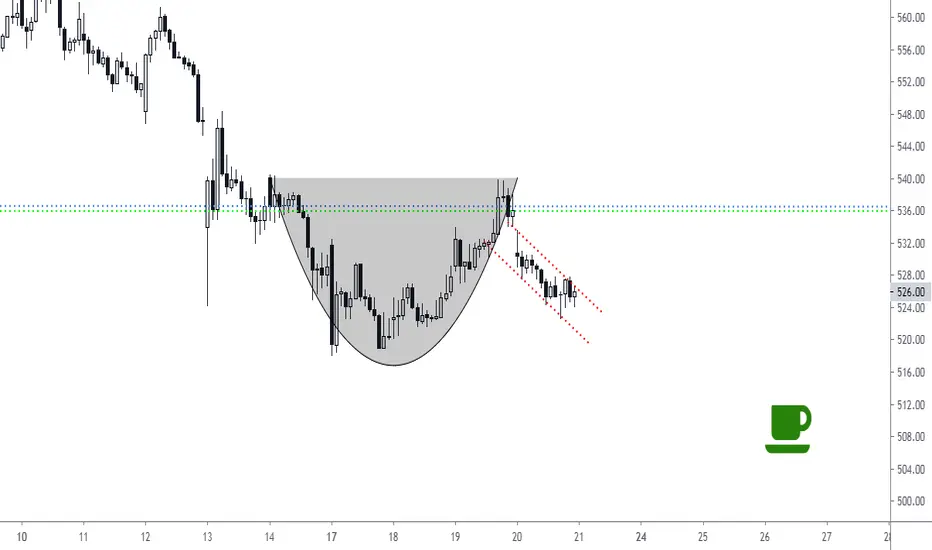
Bhartiartl - Double BottomBhartiairtel may reverse from CMP as it formed double bottom and also has a demand zone at 536, so it might come down till 536 (I will wait 530)... Above strong supply at 565-570 which need to be broken for further upward move... Targets on chart....


Bharti Airtel - Fading Momentum on Weekly TimeframeBharti Airtel weekly chart history does give a clue of what has happened when rise in price was not supported with rise in momentum.
Details in the chart.


Easy longCould be a big long with a very less stoploss .If the trend breaks down then it would be a huge fall.

Bhartiairtel on a Brink of FallIt's not easy for a strong momentum to break down. Stock upmove is emotional in psychology to the investors and positional traders. It is a pure distress if it fails to respect the hope and expectation.
A failure of the Point 1 accumulation in BHARTIAIRTEL would pull back the stock to a downward spiral.

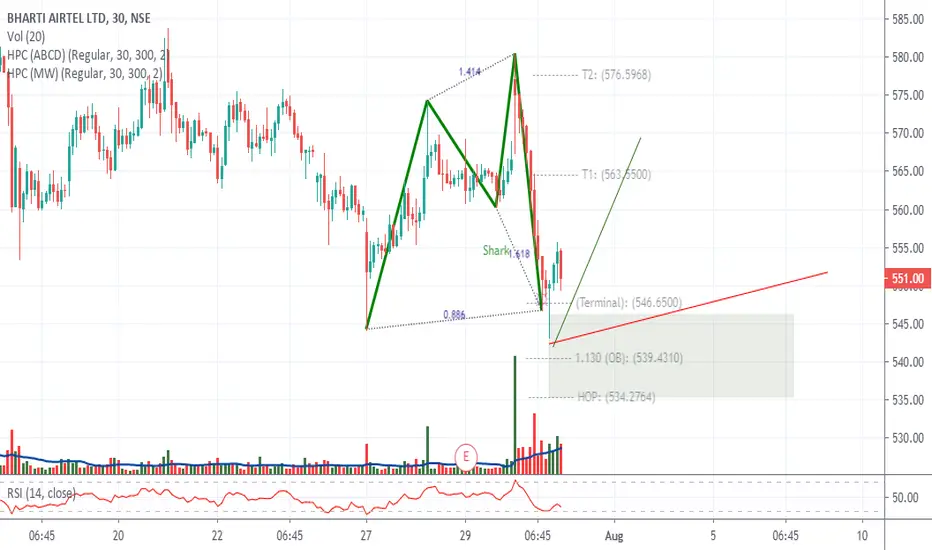
BHARTIARTL 30MNBULLISH Shark@0.886XA as Potential reversal zone
price need to follow Green Trend line & hit target
If price Breaks Red Trend line is where EXIT before SL hits
POTENTIAL BUY
long on bhariairtelLook like BHARTIAIRTEL has completed triple three pattern (WXYXZ) and if this pattern is correctly identified then primary trend upward is going to come. If I would give 3-4 weeks time to analyze this.
If it starts going down then I will exit else its good long trade.. chances are high for reversal here.

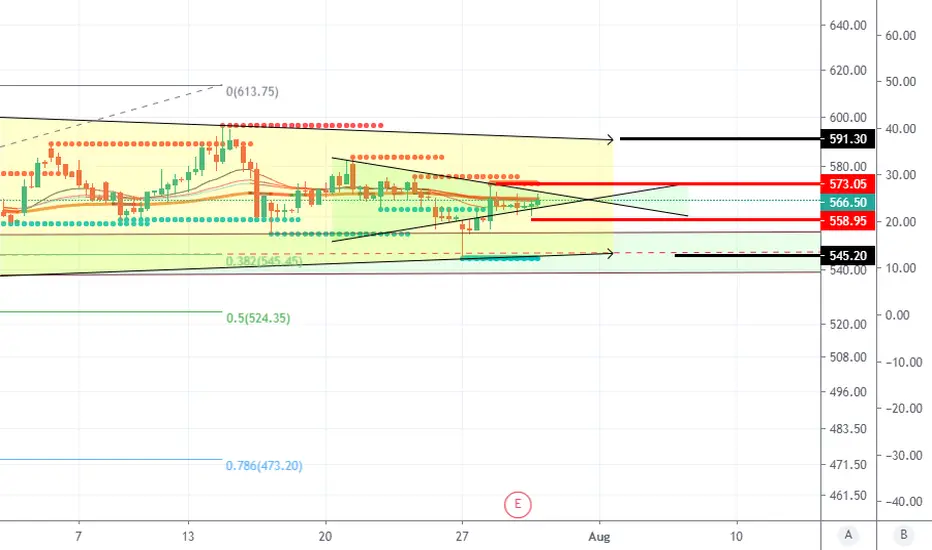
both side targets bharti airtelbuy above 573 for target of 590
sale below 558 for target of 545
in both case make stop loss if bought above 573 will be 570
sold below 558 will be 562
On Weekly Pattern It formed Flag and Peanut Airtel Is ready to Breakout and Close above 600 will make it bullish, and can shoot up another 20% easily. in 2-3 months.
SL 530
TARGET 720
BUY ABOVE 600 WHEN CLOSED ONCE
Results are superb, better than street expectations

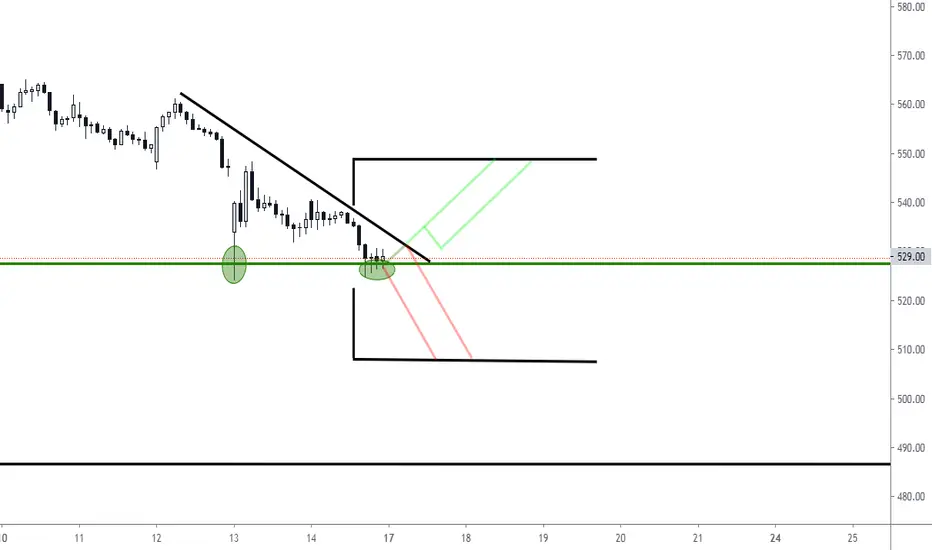
For educational purposes onlyWhn the candle comes near green line
below key level and it starts to go up then is a good time to enter. Stoploss can be kept below the key level
