Darvas Box Strategy - Break out StockDisclaimer: I am Not SEBI Registered adviser, please take advise from your financial adviser before investing in any stocks. Idea here shared is for education purpose only.
Stock has given break out. Buy above high. Keep this stock in watch list.
Buy above the High and do not forget to keep stop loss best suitable for swing trading.
Target and Stop loss Shown on Chart. As stop loss is Big we keep Initial Target Ratio 1:1
Be Discipline, because discipline is the key to Success in Stock Market.
Trade what you See Not what you Think.
BHARTIARTL trade ideas

Breakout Trading Good Opportunity for Swing Traders / Positional Traders
1D Time Frame
Keep an Close eye

Airtel intraday level for 20th Aug #AirtelAirtel intraday level for 20th Aug #Airtel
Buying may witness above 1475
Support area 1459. Below ignoring buying momentum for intraday
Selling may witness below 1459
Resistance area 1475.
Above ignoring selling momentum for intraday
Charts for Educational purposes only.
Please follow strict stop loss and risk reward if you follow the level.
Thanks,
V Trade Point

Bharati Airtel Ltd intraday level for 7th Aug #BHARTIARTL Bharati Airtel Ltd intraday level for 7th Aug #BHARTIARTL
Buying may witness above 1455
Support area 1430. Below ignoring buying momentum for intraday
Selling may witness below 1430
Resistance area 1455. Above ignoring selling momentum for intraday
Charts for Educational purposes only.
Please follow strict stop loss and risk reward if you follow the level.
Thanks,
V Trade Point

Bharati Airtel Ltd intraday level for 5th Aug #BHARTIARTL Bharati Airtel Ltd intraday level for 5th Aug #BHARTIARTL
Buying may witness above 1505
Support area 1483-1485. Below ignoring buying momentum for intraday
Selling may witness below 1483
Resistance area 1500-1505. Above ignoring selling momentum for intraday
Charts for Educational purposes only.
Please follow strict stop loss and risk reward if you follow the level.
Thanks,
V Trade Point

BHARTI AIRTEL LTD S/R Support and Resistance Levels: In technical analysis, support and resistance levels are significant price levels where buying or selling interest tends to be strong. They are identified based on previous price levels where the price has shown a tendency to reverse or find support.
Support levels are represented by the green line and green shade, indicating areas where buying interest may emerge to prevent further price decline.
Resistance levels are represented by the red line and red shade, indicating areas where selling pressure may arise to prevent further price increases. Traders often consider these levels as potential buying or selling opportunities.
Breakouts: Breakouts occur when the price convincingly moves above a resistance level (red shade) or below a support level (green shade). A bullish breakout above resistance suggests the potential for further price increases, while a bearish breakout below support suggests the potential for further price declines. Traders pay attention to these breakout signals as they may indicate the start of a new trend or significant price movement.
20 EMA: The yellow line denotes 20 EMA, to interpret the 20 EMA, you need to compare it with the prevailing stock price. If the stock price is below the 20 EMA, it signals a possible downtrend. But if the stock price is above the 20 EMA, it signals a possible uptrend.
Disclosure: I am not SEBI registered. The information provided here is for learning purposes only and should not be interpreted as financial advice. It is important to consult with a qualified financial advisor before making any investment decisions. Tweets neither advice nor endorsement.

Bharati Airtel Ltd Intraday level for 29th July #BHARTIARTL Bharati Airtel Ltd Intraday level for 29th July #BHARTIARTL
Buying may witness above 1522
Support area 1500. Below ignoring buying momentum for intraday
Charts for Educational purposes only.
Please follow strict stop loss and risk reward if you follow the level.
Thanks,
V Trade Point
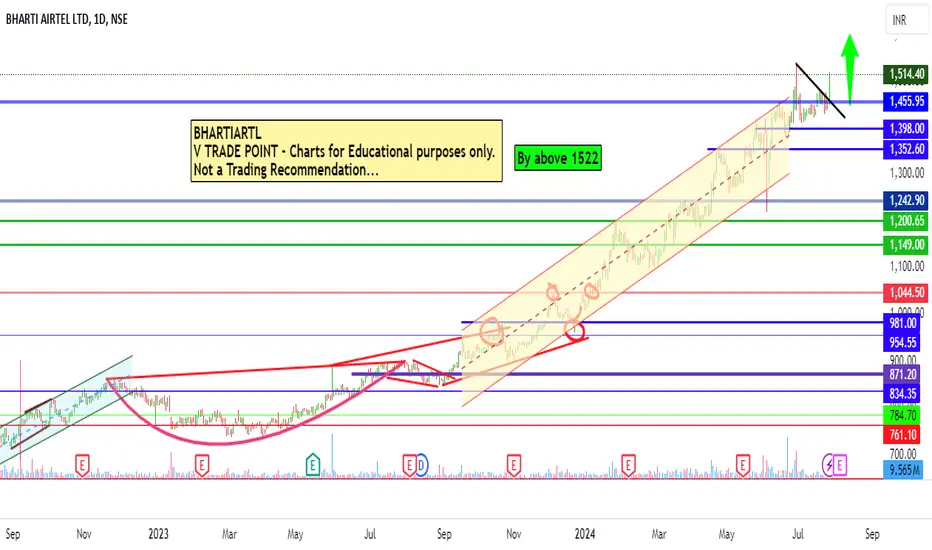
bharathi airtel breakoutairtel has given breakout .
cmp: 1514.40
immediate target _____ 1536 .
second target will be 1576

Airtel Intraday level for 24th July #BHARTIARTL Airtel Intraday level for 24th July #BHARTIARTL
Buying may witness above 1472
Support area 1460. Below ignoring buying momentum for intraday only
Charts for Educational purposes only.
Please follow strict stop loss and risk reward if you follow the level.
Thanks,
V Trade Point

Bharti Airtel Buying Opportunity There is Institution buying zone at current level price, we can go long from this level.
I am NOT a SEBI registered advisor or a financial adviser. Any of my investment or trade ideas I share on my profile are only my view point.

Bharti Airtel Breaks Ascending Trendline: A Strong Buy SignalBharti Airtel Ltd demonstrates a powerful breakout above its ascending trendline, presenting a compelling buy opportunity for investors. The stock's upward movement is supported by increased trading volume, suggesting sustained bullish momentum.

BHARTIAIRTEL-LONGSharing my bullish outlook based on BHARTIAIRTEL. Would love to hear your thoughts and insights on this setup.

BHARTI AIRTEL AT RESISITNCE -EXPECTING FALL FROM 18 JUN IF SUSTIANS NICE BREAKOUT CAN BE SEEN to 1540 , IF NOT then 1360 fall expected.( FALL Looks to Be More Probable let us See

Airtel Intraday level fo 24th June #BHARTIARTL Airtel Intraday level fo 24th June #BHARTIARTL
Buying opportunity above 1422
Stop Loss area 1410
Charts for Educational purposes only.
Please follow strict stop loss and risk reward if you follow the level.
Thanks,
V Trade Point

BHARTI AIRTEL LTD S/RSupport and Resistance Levels: In technical analysis, support and resistance levels are significant price levels where buying or selling interest tends to be strong. They are identified based on previous price levels where the price has shown a tendency to reverse or find support.
Support levels are represented by the green line and green shade, indicating areas where buying interest may emerge to prevent further price decline.
Resistance levels are represented by the red line and red shade, indicating areas where selling pressure may arise to prevent further price increases. Traders often consider these levels as potential buying or selling opportunities.
Breakouts: Breakouts occur when the price convincingly moves above a resistance level (red shade) or below a support level (green shade). A bullish breakout above resistance suggests the potential for further price increases, while a bearish breakout below support suggests the potential for further price declines. Traders pay attention to these breakout signals as they may indicate the start of a new trend or significant price movement.
Disclosure: I am not SEBI registered. The information provided here is for learning purposes only and should not be interpreted as financial advice. It is important to consult with a qualified financial advisor before making any investment decisions. Tweets neither advice nor endorsement.

Airtel view for intraday level fo 21st June #BHARTIARTL Airtel view for intraday level fo 21st June #BHARTIARTL
Selling opportunity below 1375
Stop Loss area 1390
Charts for Educational purposes only.
Please follow strict stop loss and risk reward if you follow the level.
Thanks,
V Trade Point

@BHARTIARTL Swing/short Term TradeBHARTIARTL
Entry Above : @1365.
SL Below : @1319.
Targets : @1419, @1456,@1604.
If you want minimize risks After Entry put @SL at last Higher-Low(HL) or follow trend line as SL or Trailing-SL.
Plz Note : This levels are only for Swing Trade & Disclaimer : All Information on this page is for educational purposes only , we are not SEBI Registered. Please consult a SEBI Registered financial advisor for your Financial matter before investing & taking any decision. We are not responsible for any profit/loss you made.
Like, Comment & Share

Airtel intraday level fo 19th June #BHARTIARTL Airtel intraday level fo 19th June #BHARTIARTL
Buying opportunity above 1435
Stop Loss area 1420
Charts for Educational purposes only.
Please follow strict stop loss and risk reward if you follow the level.
Thanks,
V Trade Point

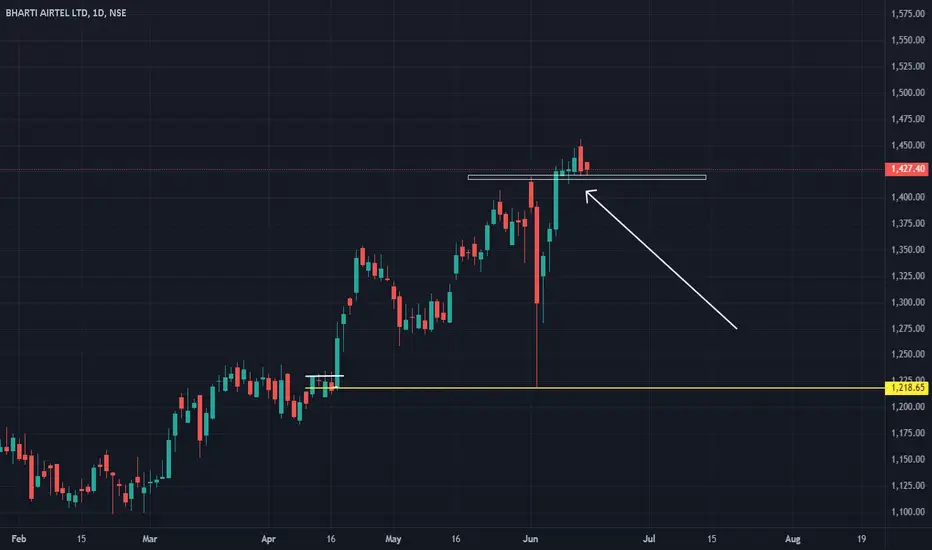
Bharti Airtel Strong Uptrend. Will it "HOLD"Bharti Airtel has been moving up strongly on all the higher time frames. On the Daily it has created a new Demand Zone. We expect price to pull to this level and continue to move to the upside

Bharti Airtel10/06/2024
Bharti Airtel
CMP:1426
Target: 1460-1500
SL: As per risk
Information is only for study purpose

Bharti Airtel Intraday level for today #BHARTIARTL Bharti Airtel Intraday level for today #BHARTIARTL
Buying opportunity above 1378
Stop Loss area 1360
Charts for Educational purposes only.
Please follow strict stop loss and risk reward if you follow the level.
Thanks,
V Trade Point

Bharti Airtel Ltd. (BHARTIARTL) ForecastThe chart represents the 4-hour price movement of Bharti Airtel Ltd. on the NSE. Here is an analysis and summary:
Analysis:
1. Price Trend: The price has been making higher highs, indicating an upward trend.
2. Volume: The volume is relatively low despite the price making higher highs, suggesting potential weakness in the current uptrend.
3. Divergence Pattern: There appears to be a divergence pattern, which often signals a potential reversal.
4. Support and Resistance Levels:
- Resistance: The price has recently hit resistance around 1379.
- Support Levels: Multiple support levels are indicated at 1332.50, 1266.05, and 1217.15.
5. Possible Sell Signal: The combination of higher highs with low volume and a divergence pattern suggests a possible sell signal.
Forecasted Movement:
- Short-term: The price might experience a pullback or correction from the current levels. It is projected to first drop to the support at 1332.50.
- Medium-term: If it breaks the 1332.50 level, the next target would be around 1266.05.
- Long-term: A further decline could see the price reaching the 1217.15 support level.
Summary:
The chart indicates a possible bearish outlook for Bharti Airtel Ltd. due to the combination of higher highs with low volume and the divergence pattern. Key support levels to watch are at 1332.50, 1266.05, and 1217.15. If these levels are breached, it could confirm the downtrend and result in further price declines.
