BHEL trade ideas


Bhel double bottom reversalCaught bhel double bottom reversal and waiting for retest.........can reach the target of 74.00


BHELForming a ascending triangle, buy with target of 83, SL of 70.5 in swing tread.
☠️☠️☠️
Above ideas are for educational purposes only, kindly consult your financial advisor before investing.
Please don’t forget to 👍 and subscribe if you like the idea.


BHEL NEXT TARGET 71.4looks like BHEL 's next immediate target is 71.4
crossing of which good upward movement is possible

BHEL clear-cut breakout. JOURNEY TOWARDS 80+++BHEL has given a breakout on daily and weekly charts, after long consolidation has it moved past the 56 levels. Can be seen travelling towards 73 and in long time frame towards 180. Fundamentally changes have been made in the management, new project wins and book renewal can impact this stock.
HODL for BHEL ka jalwa!


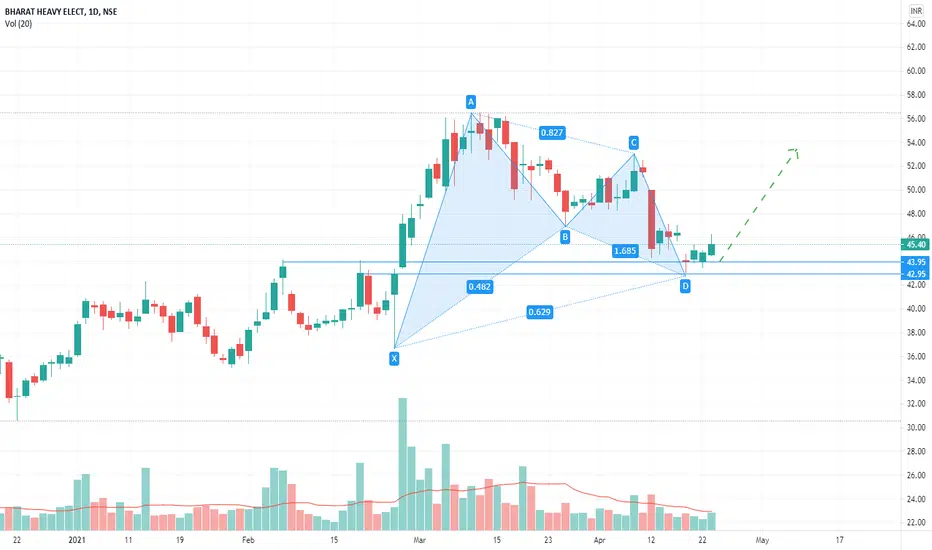
BHEL - Swing Trade - Weekly chartThis analysis is done purely on basis of price action and chart patterns.
The analysis is done on weekly TF hence it can take couple of days to couple of weeks/months to reach the target.
The image is self explanatory.
Range for entry, SL and Target is shown in image itself.
Since this is a stock of NIFTY ENERGY index, one can refer the weekly chart of NIFTY ENERGY as well.
This analysis is for study purpose.
Traders must do their own study before entering into any trade. Traders should trade with their own risk capacity and money management.
Feel Free to comment for any query or suggestion regarding this stock or Price Action Analysis/Chart Study
Check out my previous analysis on this stock. Idea is linked below.

BHEL Long above Rs 57Inverse Head & Shoulder pattern formation on weekly charts with strong volumes!


Buy BHEL The chart speaks for itself. With RSI given an uptick or BO, the price will eventually BO of the Descending triangle. All you need is patience to hold it for upside of 15-20% atleast. It can try to achieve previous Swing Highs of 56odds.


BHEL Investment PickBHEL breakout after long time.. buy at CMP and add on dip till 42/43.... Sl monthly closing below 20 sma.. targets mentioned on chart...
Note :- i am not Sebi registered analyst.. before investing ask your sebi registered financial advisor..
