Biocon: Heading for All-Time High?🚀 Biocon: Heading for All-Time High? 🚀
📉 CMP: ₹390
🔒 Stop Loss: ₹330
🎯 Targets: ₹428 | ₹478 | ₹560
🔍 Why Biocon Looks Promising?
✅ Weekly Rounding Bottom Breakout: Breakout triggered above ₹390
✅ Weekly Box Breakout: Confirmation above ₹398 strengthens the setup
✅ Final Confirmation: A weekly close above ₹402 will validate the breakout for a potential strong upside
💡 Strategy & Risk Management:
📈 Phased Entry: Build positions gradually post confirmation to manage risk effectively
🔒 Strict SL: Maintain stop loss at ₹330 to protect capital in case of reversal
📍 Outlook: Biocon is showing strong technical signals with an all-time high on the radar, making it a compelling positional trade setup.
📉 Disclaimer: Not SEBI-registered. Please do your own research or consult a financial advisor before investing.
#Biocon #PharmaStocks #TechnicalBreakout #AllTimeHigh #SwingTrading #StockMarket #InvestmentOpportunities
BIOCON trade ideas

multiyear breakout candidate BIOCONNext laurus like move loading in biocon
rsi strong strong price action
volume pretty cool

BioconBiocon is trading above 200 ema on multi time frame
As marked it has consolidated for last few days suggesting accumulation phase. Any confirmation of price action on upper side will give good risk to reward trade.
This is only a chart analysis not a recommendation to buy or sell. Please consult your financial advisor before buying or selling.
BIOCON LIMITED KEY ZONE !!This is the Daily chart of BIOCON LIMITED.
Biocon is currently trading near its pattern resistance zone around the 340 range.
BIOCON has a strong support zone near the 300 range.
Thank You !!

Biocon looks weakBiocon is not a buy from any angle at the moment. If you want to invest in it, buy it in bits and pieces. For swing traders, the risk reward is to the downside. Forming Head and Shoulders on weekly. Head and shoulders is a very powerful pattern, and the expected move to the downside would be almost equal to the distance between the peak (head) to the baseline...I won't be buying Biocon until it comes to much lower levels.....Trade safe

BIOCON LTD SWING TRADE📊 Price Action & Trend Analysis
Analyzing market trends using price action, key support/resistance levels, and candlestick patterns to identify high-probability trade setups.
Always follow the trend and manage risk wisely!
Price Action Analysis Interprets Market Movements Using Patterns And Trends On Price Charts.
👉👉👉Follow us for Live Market Views/Trades/Analysis/News Updates.

BIOCONNSE:BIOCON
One Can Enter Now !
Or Wait for Retest of the Trendline (BO) !
Or wait For better R:R ratio !
Note :
1.One Can Go long with a Strict SL below the Trendline or Swing Low.
2. R:R ratio should be 1 :2 minimum
3. Plan as per your RISK appetite and Money Management.
Disclaimer : You are responsible for your Profits and loss, Shared for Educational purpose
BIOCON |If weekly close above 400Disclaimer:
This is not financial advice. Please do your own research or consult with a financial advisor before making any investment decisions. Investments in stocks can be risky and may result in loss of capital.

Biocon Stock Analysis Current Landscape:
Market Cap: ₹46,547 Crores (Indicating a large-sized company)
PE Ratio: 32.34 (Slightly lower than the industry PE of 40.38, suggesting potential undervaluation)
Book Value: ₹174.85 (Represents the value of each share as per company accounts)
Price to Book Value (PBV): 2.22 (Indicates that the market values the company 2.22 times its book value)
Solvency Ratio Improvement: Suggests a strengthening of the company's financial stability
Technical Analysis:
Today's Gain: A 6.15% surge today reflects positive investor sentiment.
New Resistance Level: ₹395 now acts as a key resistance level.
Future Outlook: A breach of this level could propel the stock towards its all-time high of ₹488.
Subsequent Targets: New targets will be determined after surpassing the ₹488 level.
Conclusion:
Biocon's stock currently exhibits promising signs. Improved solvency ratios, robust technical indicators, and a lower PE ratio compared to the industry average make it an attractive investment prospect. However, investors should closely monitor the breach of the ₹395 resistance level. A successful breakthrough could signal further potential for stock appreciation.

BIOCON LTD S/RSupport and Resistance Levels:
Support Levels: These are price points (green line/shade) where a downward trend may be halted due to a concentration of buying interest. Imagine them as a safety net where buyers step in, preventing further decline.
Resistance Levels: Conversely, resistance levels (red line/shade) are where upward trends might stall due to increased selling interest. They act like a ceiling where sellers come in to push prices down.
Breakouts:
Bullish Breakout: When the price moves above resistance, it often indicates strong buying interest and the potential for a continued uptrend. Traders may view this as a signal to buy or hold.
Bearish Breakout: When the price falls below support, it can signal strong selling interest and the potential for a continued downtrend. Traders might see this as a cue to sell or avoid buying.
MA Ribbon (EMA 20, EMA 50, EMA 100, EMA 200) :
Above EMA: If the stock price is above the EMA, it suggests a potential uptrend or bullish momentum.
Below EMA: If the stock price is below the EMA, it indicates a potential downtrend or bearish momentum.
Trendline: A trendline is a straight line drawn on a chart to represent the general direction of a data point set.
Uptrend Line: Drawn by connecting the lows in an upward trend. Indicates that the price is moving higher over time. Acts as a support level, where prices tend to bounce upward.
Downtrend Line: Drawn by connecting the highs in a downward trend. Indicates that the price is moving lower over time. It acts as a resistance level, where prices tend to drop.
Disclaimer:
I am not a SEBI registered. The information provided here is for learning purposes only and should not be interpreted as financial advice. Consider the broader market context and consult with a qualified financial advisor before making investment decisions.

BIOCON UPDATE🚀 Biocon (BIOCON) – Moving After Consolidation – Stay Confident! 🚀
Trade Update:
I entered a long position on Biocon during the consolidation phase, and it’s now starting to show some movement. The price action has been quiet for a while, but we are finally seeing the breakout I was anticipating.
1. Breakout After Consolidation:
The price is now moving upwards, confirming the breakout and the end of the consolidation phase.
This is a classic move where price breaks out from a range, and the momentum can carry it higher.
2. Technical Indicators:
Volume has been increasing, showing that this move has strength and backing.
The Moving Average (MA) is also supporting the bullish trend, with the price above .
3. Current Position:
Entry: I entered at 324.20 avg during the consolidation phase.
Target: My first target is with a potential for further upside if momentum continues.
Stop Loss: I’ve placed my stop loss at to manage risk in case of any pullback.
4. Trade Management:
I’m monitoring the price action closely. If the move gains more strength, I may adjust my targets higher.
For anyone who followed, ensure you’re keeping a close eye on the key levels of support and resistance to manage risk effectively.
5.Confidence in the Move:
This trade was based on a strong technical setup, and I’m confident it has the potential for further upside as long as the trend continues to hold.
Disclaimer: This is my personal trade and not financial advice. Please do your own research and manage your risk appropriately.
#indianstocks #pharmasector #cnxpharma #swingtrading

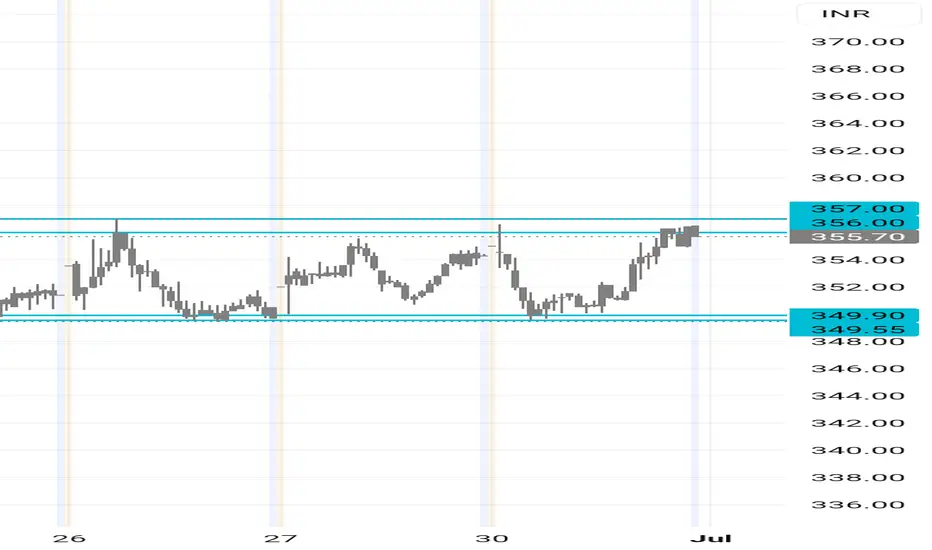
Biocon Ltd view for Intraday 3rd Dec #BIOCON Biocon Ltd view for Intraday 3rd Dec #BIOCON
Resistance 378-380 . Watching above 380 for upside movement...
Support area 370 Below 375 ignoring upside momentum for intraday
Support 370 Watching below 369 for downside movement...
Resistance area 378-380
Above 375 ignoring downside move for intraday
Charts for Educational purposes only.
Please follow strict stop loss and risk reward if you follow the level.
Thanks,
V Trade Point


#BIOCON WTF #BIOCON is has bounce back from 50% FIBO, A good Entry is 360 with SL 340 DTF Close. Enter wit 50% Qty,
Add 50% when close above 390
TGT in Charts

Biocon Ltd view for Intraday 12th Nov #BIOCON Biocon Ltd view for Intraday 12th Nov #BIOCON
Resistance 350 Watching above 352 for upside movement...
Support area 344. Below 344 ignoring upside momentum for intraday
Support 344.Watching below 350 for downside movement...
Resistance area 350
Above 858 ignoring downside move for intraday
Charts for Educational purposes only.
Please follow strict stop loss and risk reward if you follow the level.
Thanks,
V Trade Point


biocon buy for swing/positional
biocon buy near 332
avg at near 326
sl at 320 4%sl
tgt 4% 8% 12%16%18%

Biocon ltd view for Intraday 30th September #BIOCON Biocon ltd view for Intraday 30th September #BIOCON
Buying may witness above 371
Support area 365. Below ignoring buying momentum for intraday
Selling may witness below 365
Resistance area 370
Above ignoring selling momentum for intraday
Charts for Educational purposes only.
Please follow strict stop loss and risk reward if you follow the level.
Thanks,
V Trade Point

BIOCON S/RSupport and Resistance Levels:
Support Levels: These are price points (green line/shade) where a downward trend may be halted due to a concentration of buying interest. Imagine them as a safety net where buyers step in, preventing further decline.
Resistance Levels: Conversely, resistance levels (red line/shade) are where upward trends might stall due to increased selling interest. They act like a ceiling where sellers come in to push prices down.
Breakouts:
Bullish Breakout: When the price moves above resistance, it often indicates strong buying interest and the potential for a continued uptrend. Traders may view this as a signal to buy or hold.
Bearish Breakout: When the price falls below support, it can signal strong selling interest and the potential for a continued downtrend. Traders might see this as a cue to sell or avoid buying.
20 EMA (Exponential Moving Average):
Above 20 EMA(50 EMA): If the stock price is above the 20 EMA, it suggests a potential uptrend or bullish momentum.
Below 20 EMA: If the stock price is below the 20 EMA, it indicates a potential downtrend or bearish momentum.
Trendline: A trendline is a straight line drawn on a chart to represent the general direction of a data point set.
Uptrend Line: Drawn by connecting the lows in an upward trend. Indicates that the price is moving higher over time. Acts as a support level, where prices tend to bounce upward.
Downtrend Line: Drawn by connecting the highs in a downward trend. Indicates that the price is moving lower over time. It acts as a resistance level, where prices tend to drop.
RSI: RSI readings greater than the 70 level are overbought territory, and RSI readings lower than the 30 level are considered oversold territory.
Combining RSI with Support and Resistance:
Support Level: This is a price level where a stock tends to find buying interest, preventing it from falling further. If RSI is showing an oversold condition (below 30) and the price is near or at a strong support level, it could be a good buy signal.
Resistance Level: This is a price level where a stock tends to find selling interest, preventing it from rising further. If RSI is showing an overbought condition (above 70) and the price is near or at a strong resistance level, it could be a signal to sell or short the asset.
Disclaimer:
I am not a SEBI registered. The information provided here is for learning purposes only and should not be interpreted as financial advice. Consider the broader market context and consult with a qualified financial advisor before making investment decisions.

BICON may test 395This is for study purpose. This counter is selected based on purely candle theory. CMP is 368.85. Entry level near 360, SL level 349, TG 395. Lets see how price unfolds during upcoming trading sessions.

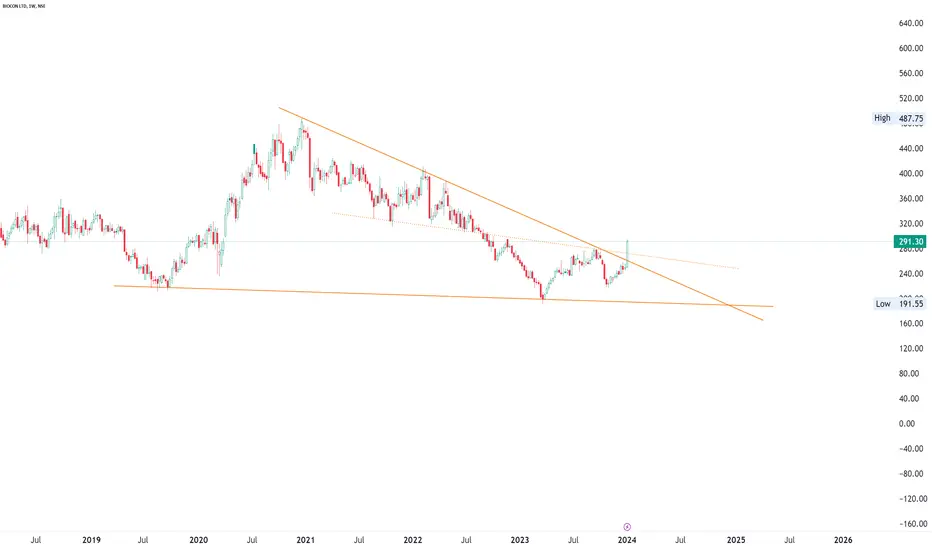
BIOCON Long Term Chart AnalysisBIOCON Long Term (Monthly Chart Pattern). we can BUY @CMP put SL @216 and Target 709

BIOCON BEARISH FLAGFollowing the decline, the price entered a consolidation phase, trading between ₹300 and ₹320 for several days, forming the flag.
The price then breaks below ₹300 with higher volume, confirming the bearish flag pattern.
Traders interpreting this pattern might anticipate further decline in Biocon's stock price and consider short-selling opportunities or adjust their investment strategies accordingly.

Biocon-Bullish Swing- W Pattern breakout? NSE:BIOCON
04.09.2024
Buy- Above 383.5
Target-412
Stop Loss-364.5
Risk Reward- 1:1.5
1.Inside bar and resistance breakout
2.Price is under consolidation from last three months
after uptrend movement
3.Price has crossed strong resistance zone with healthy
green candle with very good volumes
4.Price rejection from 21 EMA.
5. FVG rejection before breakout
6. W pattern formation and breakout expected
