Birla Corporation – Is This the Right Time to Invest?Step-by-Step Analysis
1. Monthly Timeframe Analysis
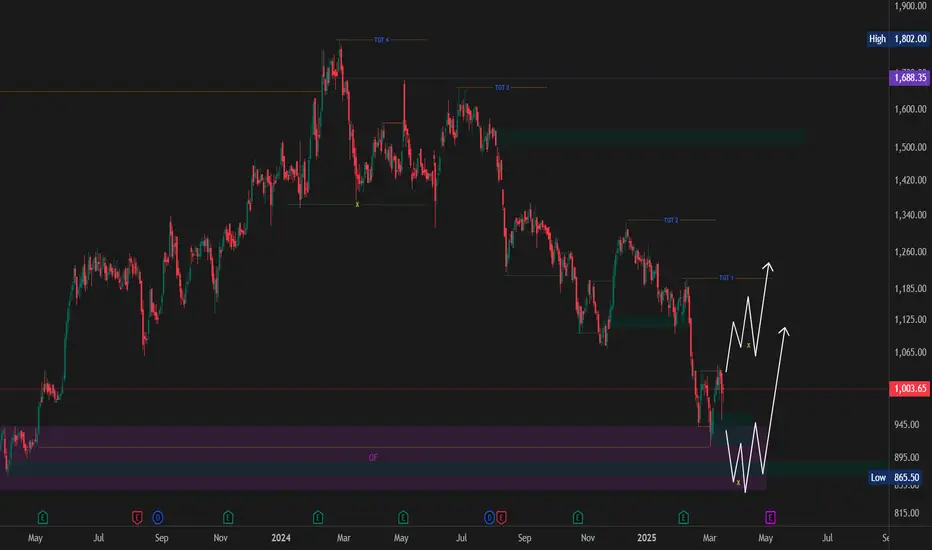
📌 Previous Monthly Swing High: ₹1,650 (Liquidity Taken)
📌 Current Market High: ₹1,802
📌 Key Swing Low: ₹1,060.55
📌 Accumulation Zone: ₹943 – ₹846
✅ The price has now reached this accumulation range, making it a potential long-term buying opportunity.
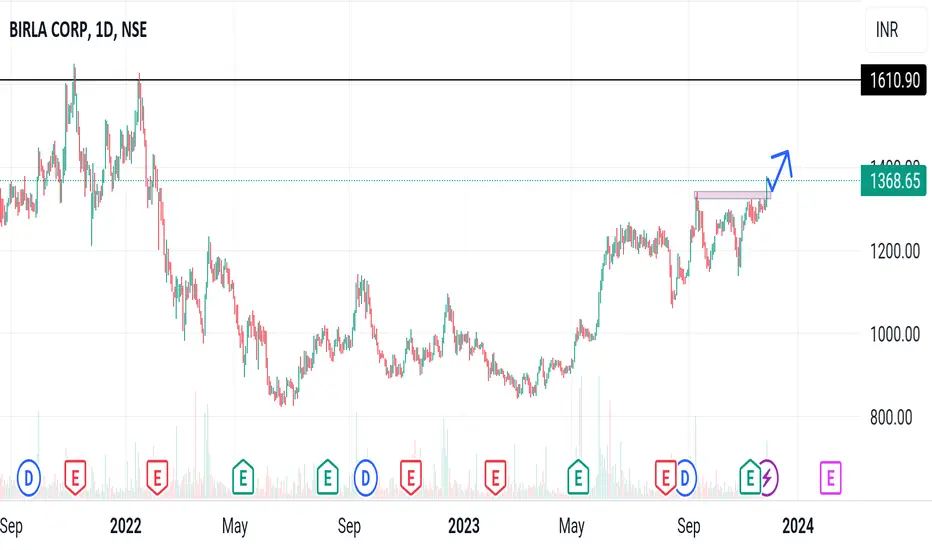
2. Daily Timeframe Confirmation
✅ The daily chart shows a liquidity sweep and a structure shift, supporting a potential reversal.
✅ While the price is in the monthly buying zone, we still need additional confirmation before committing to a full position.
✅ Key Entry Levels for Investors:
₹960 – ₹915: First zone to accumulate small quantities.
₹889 – ₹865: If the market dips further, this range offers a strong investment opportunity.
3. Profit Targets & Risk Management
📈 Profit Targets:
1️⃣ ₹1,215 – First target (short-term)
2️⃣ ₹1,330 – Second target (mid-term)
3️⃣ ₹1,657 – ₹1,800+ – Major long-term targets
📉 Stop-Loss Strategy:
Set your stop-loss based on risk tolerance.
Conservative traders can place stop-loss near ₹750 – ₹730, ensuring a good risk-reward ratio.
Investment Strategy
🔹 Scenario 1: If price confirms reversal in the daily timeframe, early accumulation between ₹960 – ₹915 can be done.
🔹 Scenario 2: If price drops further below ₹910, investors can accumulate between ₹889 – ₹865.
🔹 Scenario 3: If price fails to hold these levels, wait for confirmation before further investment.
Final Thoughts
📊 This analysis is based on Smart Money Concepts (SMC) and liquidity-based trading strategies. While the accumulation zone is active, additional confirmation is recommended. Always conduct your own research and consult with financial experts before making an investment decision.
💡 Key Takeaway: Birla Corporation is at a potential investment-worthy level, but confirmation is crucial before committing large capital.
👉 Would you like a TradingView chart with this analysis? Let me know! 🚀
BIRLACORPN trade ideas
BIRLA CORPORATION LTD S/RSupport and Resistance Levels:
Support Levels: These are price points (green line/shade) where a downward trend may be halted due to a concentration of buying interest. Imagine them as a safety net where buyers step in, preventing further decline.
Resistance Levels: Conversely, resistance levels (red line/shade) are where upward trends might stall due to increased selling interest. They act like a ceiling where sellers come in to push prices down.
Breakouts:
Bullish Breakout: When the price moves above resistance, it often indicates strong buying interest and the potential for a continued uptrend. Traders may view this as a signal to buy or hold.
Bearish Breakout: When the price falls below support, it can signal strong selling interest and the potential for a continued downtrend. Traders might see this as a cue to sell or avoid buying.
MA Ribbon (EMA 20, EMA 50, EMA 100, EMA 200) :
Above EMA: If the stock price is above the EMA, it suggests a potential uptrend or bullish momentum.
Below EMA: If the stock price is below the EMA, it indicates a potential downtrend or bearish momentum.
Trendline: A trendline is a straight line drawn on a chart to represent the general direction of a data point set.
Uptrend Line: Drawn by connecting the lows in an upward trend. Indicates that the price is moving higher over time. Acts as a support level, where prices tend to bounce upward.
Downtrend Line: Drawn by connecting the highs in a downward trend. Indicates that the price is moving lower over time. It acts as a resistance level, where prices tend to drop.
Disclaimer:
I am not a SEBI registered. The information provided here is for learning purposes only and should not be interpreted as financial advice. Consider the broader market context and consult with a qualified financial advisor before making investment decisions.

BRILa Corporation VCP in Making 6x weeks 200 Range 900 + Days coVCP in Making 6x weeks 200 Range 900 + Days consolidatin must
1) SUper pattern
2) Wait for lower line touch
3) Lets see how it goes

Birla CorpLooks really as the daily candle closes above the trendline and daily 50 MA with a big gap up
Also, weekly candle closing really good with good volumes
SL below Daily 50 (on a day closing basis)
Blue levels in the chart represent the respective target levels

BIRLACORPN LONGAt the High Breakout .
Massive Volumes.
Good for Short term and Long term.
Happy Investing ...
Disclaimer : This is not a Buy or Sell recommendation. I am not SEBI Registered. Please consult your financial advisor before making any investments . This is for Educational purpose only.

BIRLA CORPORATION Buythis is flag Pattern break out...tgt calculated as per pattern...So buy with breakout candle low as stoploss...feel free to contact for details..this is a text book pattern

Small trade opportunity in BIRLACORPNSmall trade opportunity in BIRLACORPN. As the market is highly volatile. Make sure to have the correct stop loss as the trade might get reversed immediately.
Target 1: 1750
Stoploss: 1550
Happy Trading!

BIRLACORPNStock name = Birla Corporation Limited.
Weekly chart setup
Chart is self explanatory. Levels of breakout, possible up-moves (where stock may find resistances) and support (close below which, setup will be invalidated) are clearly defined.
Master Score - A
Disclaimer: This is for demonstration and educational purpose only. this is not buying and selling recommendations. I am not SEBI registered. please consult your financial advisor before taking any trade.

SWING BREAKOUT STOCKNSE:BIRLACORPN
All information on this page is for educational purposes only
we are not SEBI Registered, Please consult a SEBI registered financial advisor for your financial matters before investing And taking any decision. We are not responsible for any profit/loss you made.

BIRLACORP DAILY CHARTBirlacorp daily chart indicates a trend line breakout,
Cmp 1092 Target 1360 SL 1000
It's not a suggestion, it's an observation.

💥Birla Corp💥-Nice Breakout💥Birla Corp💥-Nice Breakout
Capital to be deployed- 20k
Investing Price-1423
Breakout Price-1423
Stoploss-1127
Targets-1939-3345
RT for max reach
#birlacorp #stockstowatch #StocksToBuy #StocksInFocus #stocks #StockMarket

BIRLASOFTThese are swing ideas which you can add your watchlist and analysis for yourself !
Keep on your radar 📡
This content only education purpose!
❗I am not sebi ragister❗
Birla corp took long#BIRLACORP
added at 1260
Just 30% trade allocation at this price.
Took less qty as market is not stable at present time.
Will update my entry and exits.

BIRLACORPN: Mixed IndicatorsThe chart should tell you everything you need to know about NSE:BIRLACORPN .
If it does, Do consider giving us that boost for motivation.
What do you make of this price action?
Have Requests, Questions, or Suggestions? DM us or comment below.👇
⚠️Disclaimer: We are not registered advisors. The views expressed here are merely personal opinions. Irrespective of the language used, Nothing mentioned here should be considered as advice or recommendation. Please consult with your financial advisors before making any investment decisions. Like everybody else, we too can be wrong at times ✌🏻

Birla corporation short term Swing Short term Swing stocks...i will buy EOD tomorrow if price trading above the blue line... Just a view.. educational purpose ONLY

Long BIRLACORPN BIRLACORPN given successful closing above 52 week high Rs 1143 a long position can be around this price and Strict Stop loss of Rs 55 that mean exit the position if come near Rs 1087 as the move fail.
Reason behind long is the strong bas formation 944-855 and break out of 52wk high with considerable volume. Target will be around all time high and more will be update as the intiated.
How to calulate stop loss so let say my Risk is Rs 2000 ( i am ready to loose 2000 rs if it goes aganist my view ) so my quantity will be around 2000/55 = 36 shares
Happy Investing/Trading Cheers.

Resistance BreakoutPlease look into the chart for a detailed understanding.
Consider these for short-term & swing trades with 2% profit.
For BTST trades consider booking
target for 1% - 2%
Please consider these ideas for educational purpose
Comment below if you are looking for any answers.


📍GOING LONG 📈 in BIRLACORP. 🧠📈📊BIRLA CORP. GOING UP FROM THIS PRICE POINT POINT
BIRLA CORP SHOWING 1 week positive RSI DIVERSION AND PRICE HOLD ON SUPPLY AREA
AND OTHER MANY ANALYSES GIVE LONG FORM THIS LAVELS
All the moving average show the positive signal

{ BIRLA CORP } SWING TRADEswing trade take trade when nifty turns bullish swing trade perfect symmetrical triangle short term opportunity for upside take trade after breakout from the trendline according to own risk this is not call just a analysis.

BIRLACORPNIn the Daily Chart of BIRLACORPN,
we can see that, after the failure of Inverted Head & Shoulder, it is now ready for up move.
Go Long if you are entering.

BIRLA CORP Buy..trading Ideaplease apply stoploss ...if you are a safe trader wait for price to correct to 1000 or nearby to enter...OR..enter one lot here and the other near 1000

Positional entry on BIRLACORPNGood risk and reward option of NSE:BIRLACORPN .
My best entry level is 895, then wait for targets of
965 (70 Points)
1005 (100 Points) &
1130 (235 Points)
My stop loss will be 825 (60 Points)
Note: This is my personal analysis, only for learning.
Thanks.
