Bluedart looking good among the many scrips in logisticsBluedart looking good among other logistics players.
Other interesting names are Gateway Distripacks, Zinka logistics
BLUEDART trade ideas

BLUE DART EXPRESS | 100% returns | Breakout of 9-year resistanceBLUE DART EXPRESS
Monthly time frame
Breakout from 9-year white resistance trend line
Breakout from perfect cup & handle pattern
Stock riding above 20-, 50- & 200-month moving averages
RSI > 60, indicating bullish momentum
MACD crossover done and is above the 0 line, indicating bullish momentum
Volumes have been good since Apr 2020, implies heavy buying
Weekly time frame
Retest of the white resistance trend line almost complete
Stock riding above 20-, 50- & 200-week moving averages
RSI > 60, indicating bullish momentum
MACD above the 0 line, indicating bullish momentum
Daily time frame
Stock consolidating along the white resistance trend line
Stock has made a higher low (Dow theory)
Stock price converging along 20- & 50- day moving averages, breakout possible
RSI > 50, indicating bullish momentum
MACD is about to cross the 0 line, indicating momentum build up
Conclusion
Entry: 8,000
Stop Loss: 6,700
Target 1: 9,600
Target 2: 12,150
Target 3: 16,275
Fundamentals
ROCE = 19.2% {Ideal > 15}
ROE = 22.7% {Ideal > 15}
Stock PE (65) = Industry PE (65) {Stock not overvalued}
Int Coverage = 5.81 {Ideal > 2}
CF Operations / EBIT = 1.83 {Ideal > 1}
Debt to equity = 0.78 {Ideal value < 1}
Promoter stake has remained consistent over the years > 75%

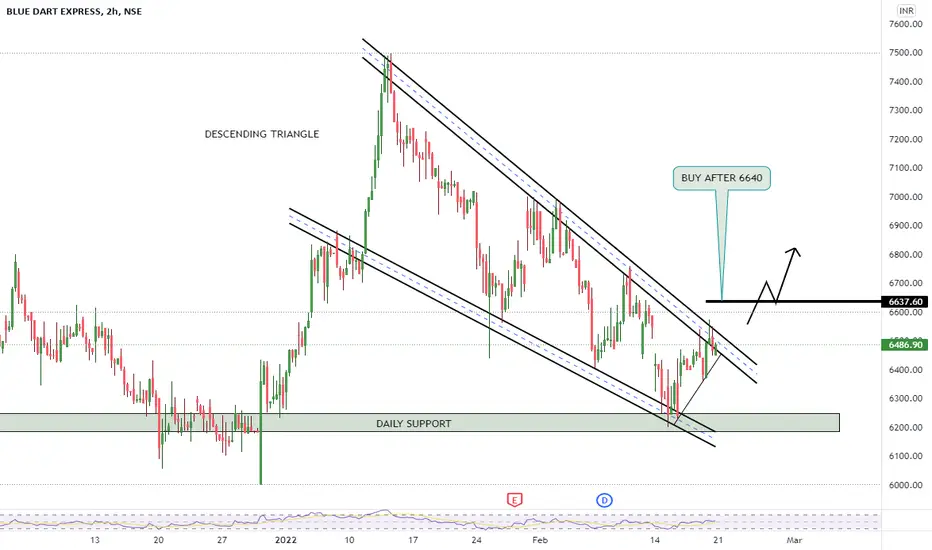
BLUDEDART : Going Long for about 0.625% of the net capitalTook an entry for about 0.625% of the net capital from a level close to the low of the parallel channel.
Will be targeting the high of the parallel channel for profit of about 47% of the invested amount. Might even consider adding on to the position if price comes down to the low of the parallel channel, depending upon the momentum of the move.
📢📢📢
If my perspective changes or if I gather additional fundamental data that influences my views, I will provide updates accordingly.
Thank you for following along with this journey, and I remain committed to sharing insights and updates as my trading strategy evolves. As always, please feel free to reach out with any questions or comments.
Other posts related to this particular position and scrip, if any, will be attached underneath. Do check those out too.
Disclaimer: The analysis shared here is for informational purposes only and should not be considered as financial advice. Trading in all markets carries inherent risks, and past performance is not indicative of future results. It’s essential to conduct your own research and assess your risk tolerance before making any investment decisions. The views expressed in this analysis are solely mine. It’s important to note that I am not a SEBI registered analyst, so the analysis provided does not constitute formal investment advice under SEBI regulations.

Analyzing Blue Dart Express Limited: Long Candle Midpoint and Pa
In the financial world, technical analysis is a key tool for investors and traders to predict future price movements based on historical data. Today, we delve into the chart of Blue Dart Express Limited (BLUEDART) on the National Stock Exchange (NSE) of India, focusing on the long candle midpoint and the parallel channel.
The Long Candle Midpoint
The chart shows a significant long candle in mid-October, where the stock experienced a substantial price movement. The midpoint of this candle, where the open and close prices meet, often acts as a pivotal level for future price action. This midpoint can serve as a support or resistance level, depending on the direction of the subsequent price movement. For BLUEDART, this level appears to be around 8,500 INR, which has been tested multiple times post the formation of the candle.
Parallel Channel
Following the long candle, the stock price of BLUEDART entered into what appears to be a descending parallel channel. This pattern is characterized by two parallel trend lines that contain the price action, with the upper line acting as resistance and the lower as support. In this chart:
Upper Channel Line: This line has been touched multiple times, indicating resistance. Each time the price hits this line, it tends to pull back, suggesting that sellers are more aggressive at this price level.
Lower Channel Line: Conversely, this acts as a support level. When the price approaches this line, it tends to bounce back up, indicating buying interest at these lower levels.
Trading Strategy Implications
Breakout/Breakdown: A breakout above the upper channel line could signal a bullish reversal, suggesting that the stock might be starting an upward trend. Conversely, a breakdown below the lower channel line could indicate further bearish momentum, potentially leading to lower price targets.
Reversion to Mean: Within the channel, trading strategies could focus on mean reversion. Buying near the lower channel line and selling near the upper could be a strategy, assuming the stock will continue to oscillate within these boundaries until a breakout occurs.
Volume and ATR: The Average True Range (ATR) at the bottom of the chart shows volatility. An increase in ATR near the channel boundaries can indicate potential breakouts or breakdowns. Volume spikes can also confirm these moves.
Conclusion
The chart for Blue Dart Express Limited provides a fascinating study in technical patterns. The long candle midpoint serves as a critical psychological level for the stock, while the descending parallel channel offers a framework for understanding potential price movements. Traders and investors should watch for price action at these key levels, coupled with volume and volatility indicators, to make informed decisions. Whether for short-term trading or long-term investment, understanding these technical aspects can significantly enhance decision-making prowess in the stock market.

BLUEDART SHORT CAUGHT!Today was a one side, short market!
I always believe in following the money - the smart money!
Coupled with the options Weekly contracts termination like BANKNIFTY, MIDCPNIFTY, FINNIFTY, etc, we are going to see more sell off in this week, as per my observation.
Dont go LONG in the market blindly tomorrow ( 14, Nov, 2024).
Good luck and Namaste!

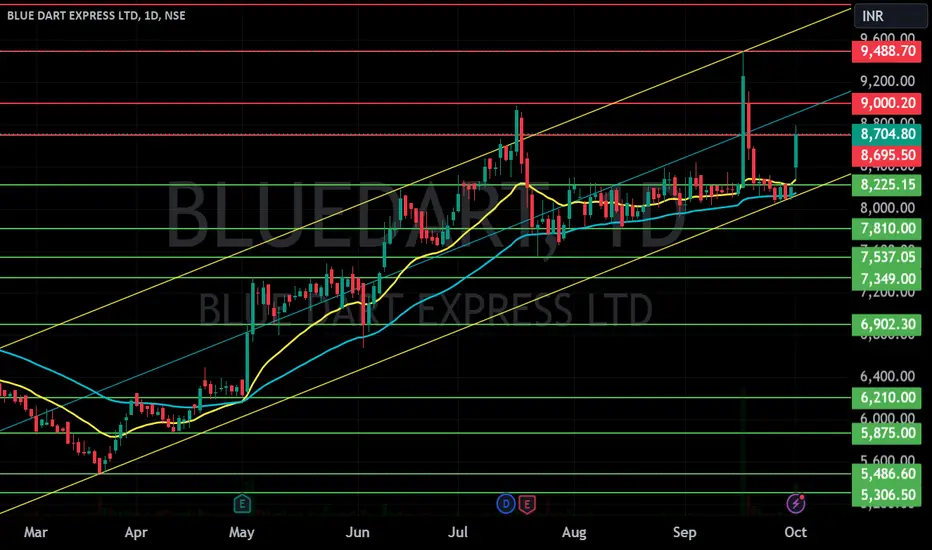
BLUEDART S/RSupport and Resistance Levels:
Support Levels: These are price points (green line/shade) where a downward trend may be halted due to a concentration of buying interest. Imagine them as a safety net where buyers step in, preventing further decline.
Resistance Levels: Conversely, resistance levels (red line/shade) are where upward trends might stall due to increased selling interest. They act like a ceiling where sellers come in to push prices down.
Breakouts:
Bullish Breakout: When the price moves above resistance, it often indicates strong buying interest and the potential for a continued uptrend. Traders may view this as a signal to buy or hold.
Bearish Breakout: When the price falls below support, it can signal strong selling interest and the potential for a continued downtrend. Traders might see this as a cue to sell or avoid buying.
20 EMA (Exponential Moving Average):
Above 20 EMA(50 EMA): If the stock price is above the 20 EMA, it suggests a potential uptrend or bullish momentum.
Below 20 EMA: If the stock price is below the 20 EMA, it indicates a potential downtrend or bearish momentum.
Trendline: A trendline is a straight line drawn on a chart to represent the general direction of a data point set.
Uptrend Line: Drawn by connecting the lows in an upward trend. Indicates that the price is moving higher over time. Acts as a support level, where prices tend to bounce upward.
Downtrend Line: Drawn by connecting the highs in a downward trend. Indicates that the price is moving lower over time. It acts as a resistance level, where prices tend to drop.
RSI: RSI readings greater than the 70 level are overbought territory, and RSI readings lower than the 30 level are considered oversold territory.
Combining RSI with Support and Resistance:
Support Level: This is a price level where a stock tends to find buying interest, preventing it from falling further. If RSI is showing an oversold condition (below 30) and the price is near or at a strong support level, it could be a good buy signal.
Resistance Level: This is a price level where a stock tends to find selling interest, preventing it from rising further. If RSI is showing an overbought condition (above 70) and the price is near or at a strong resistance level, it could be a signal to sell or short the asset.
Disclaimer:
I am not a SEBI registered. The information provided here is for learning purposes only and should not be interpreted as financial advice. Consider the broader market context and consult with a qualified financial advisor before making investment decisions.
Blue Dart Breaks Out with Ascending Trend Line and Bullish FlagBlue Dart Express has broken out of resistance with strong volume, confirming a bullish momentum. The stock is following an ascending trend line and has formed a bullish flag pattern. Traders should watch for a target price of 8900 with a stop loss set at 8190. The continuation pattern confirms bullish momentum. Keep an eye on this stock for potential gains.

Blue Dart - Huge Accumulation at Support- The chart is self-explanatory as always.
- A huge high delivery accumulation went down on 19th March at a crucial support zone
- The CMP is below the 50,100 and 200 EMA.
What do you think of this price action? Comment below...
⚠️Disclaimer: We are not registered advisors. The views expressed here are merely personal opinions. Irrespective of the language used, Nothing mentioned here should be considered as advice or recommendation. Please consult with your financial advisors before making any investment decisions. Like everybody else, we too can be wrong at times ✌🏻

17 year Breakout BLUEDART- A courier company just given a midterm resistance breakout of 7400 and headed towards it long term resistance of 7900-8000. If this manage to close over 7900(8000 for safe traders)it can witness a good upside momentum for a target of 9000-9100 keep a SL of 7400

BLUEDARTSupport and Resistance Levels: In technical analysis, support and resistance levels are significant price levels where buying or selling interest tends to be strong. They are identified based on previous price levels where the price has shown a tendency to reverse or find support.

Blue Dart Express (NSE: BLUEDART) Potential Mean Reversion PlayTechnical Analysis:
Blue Dart Express has recently bounced up from a two-year support level around 5467 and is currently trading around 6067.
The stock has shown resilience at this support level, indicating strong buying interest.
Considering historical price action, there's a potential for a mean reversion towards the range of 7284 to 7900.
Fundamental Analysis:
Blue Dart Express has maintained a stable revenue trend over the past quarters, with sales ranging between 1,000 crores to 1,400 crores.
Operating profit margins have remained healthy, fluctuating between 15% to 26%.
Quarterly EPS has shown variability but has generally been positive.
Cash flows from operating activities have shown a positive trend over the years, indicating strong operational performance.
The company's market position is dominant, with a leadership position in the domestic express delivery segment.
Ind-Ra has affirmed Blue Dart Express's Long-Term Issuer Rating at ‘IND AA’ with a Positive Outlook, citing the company's dominant market position, comfortable operational performance, and strong financial metrics.
Trade Idea:
Entry: Consider entering long positions if the stock price consolidates above the current level of 6067.
Target: Target the range of 7284 to 7900 six months timeline, which represents potential mean reversion levels based on historical price action.
Stop Loss: Set a stop-loss below the recent support level of 5467 to manage risk.
Timeframe: This trade idea may play out over the medium to long term, considering the potential for mean reversion and the Positive Outlook from Ind-Ra.
Risk Factors to Consider:
Market Volatility:
Volatility in the broader market could impact the performance of Blue Dart Express.
Economic Conditions: Changes in economic conditions could affect the demand for express delivery services.
Company-specific Risks: Any adverse developments in the company's operations or financials could impact the trade outcome
Disclaimer:
This analysis is a study conducted by an amateur investor and is published for feedback and educational purposes only. It is not intended to be investment advice or a recommendation to buy or sell securities. The information provided is based on personal opinions and should not be construed as professional financial advice.
Investing in the stock market involves risk, including the risk of losing principal. The value of investments can go up as well as down, and past performance is not indicative of future results. It is important to do your own research and consider your own financial situation and risk tolerance before making any investment decisions.
This analysis is not a SEBI registered investment, and no assurance can be given that the investment objectives will be achieved. Any investment decisions made based on this analysis are at your own risk.

Head and shoulders pattern in bluedartHead and shoulders pattern in bluedart// it is for learning purpose only.

BLUEDART Daily timeframe analysisNSE:BLUEDART Daily timeframe analysis
Buy Level 6775 with SL 6593
T1 7536
T2 7918
T3 8300

BUY IGL PRICE @ 6435 35% ROI EXPECTEDBUY IGL PRICE @ 6435 35% ROI EXPECTED
Buy1 cmp entry @6435
Target 1 @8721
ROI 1 @ 35
Buy2 Pending entry @ 5940
Target 2 @8721
ROI 2 @46
Our Unique Features
—————————————————————
1. Follow our 10 signals ….10% equity will increase in your account for sure.
2. We are not Trailing stop! or average the trades.
3. 1% Risk Management Per trade.
4. Risk vs Reward up to 25.
Note Please leave comments for any query.
Disclaimer This is my trading experience, it is not an invite or recommendation to trade.
Best Wishes
PRABHUMAYAKANNAN

Bluedart looks like selling is done and expect for some reversalBluedart seems to hitting the support zone of 5500-5600, a positive weekly close will help some breather for bulls!

BLUEDART buySignificant upside chances after a meaningful correction.
An obvious choice after the national logistics policy declaration.
Stop loss - 6570
Target - 10000

BLUEDART NSE BULLISHVIEW ABOVE 7900 CMP 8000BLUEDART NSE is bullish if 7900 holds. New LifeTime high. Positive Trend. Fresh Breakout.
Disclaimer: Educational purpose only. Not Buy/Sell Reco. Not Sebi Registered.


BLUEDARTNSE:BLUEDART
Please note that we are not a SEBI Registered Investor Adviser/PMS/ Broking House.
All the contents over here are for educational purposes only and are not investment advice or recommendations
offered to any person(s) with respect to the purchase or sale of the stocks / futures and options.
You are also requested to apply your prudence and consult your advisers in case you choose to act on
any such content available as WE claims no responsibilities for any of your actions or any outcome of
such action

BLUEDARTNSE:BLUEDART ....
Please note that we are not a SEBI Registered Investor Adviser/PMS/ Broking House.
All the contents over here are for educational purposes only and are not investment advice or recommendations
offered to any person(s) with respect to the purchase or sale of the stocks / futures and options.
You are also requested to apply your prudence and consult your advisers in case you choose to act on
any such content available as WE claims no responsibilities for any of your actions or any outcome of
such action

upward trend in blue dart continuing........from last one year it is moving upside from the level of 2200, and right now it is trading at 6500, so in upcoming days we observing that we would see the price of 10000 like srf...

BREAKOUT AND MADE 52 WEEK HIGH1 D Time frame- bluedart gave breakout from 6200 level which acted as good resistance
entry as per your style (aggressive or conservative trader)
sl 5800 i.e below days low
wait for some halt candles which can further reduce sl
target minimum 1:2
