Bombay Dyeing - Bullish shark formationBombay dyeing has completed Bullish shark formation and it has potential for following targets;
Target1: 200 (Weekly candle close above 201 will have following potential)
215 / 232 / 287 / 325
BOMDYEING trade ideas

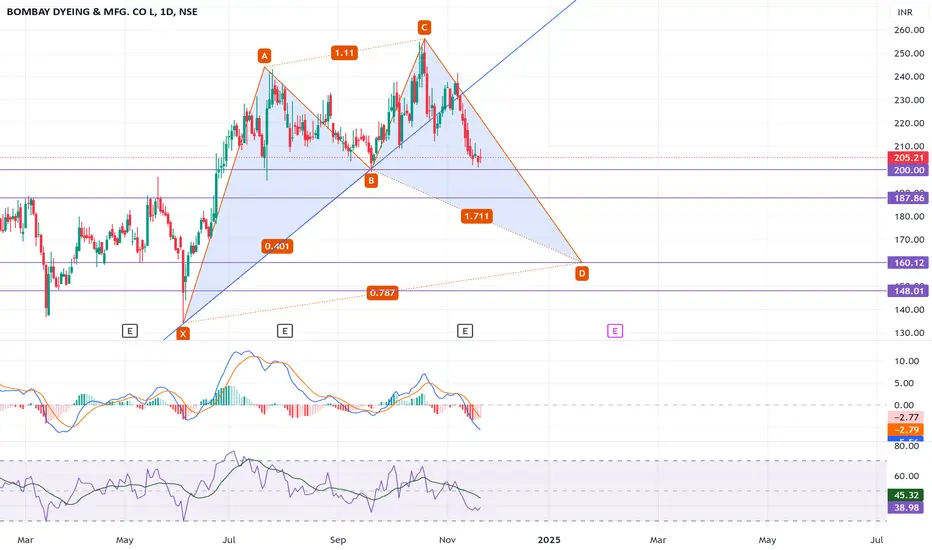
Bombay Dyeing 160/150 possible if broken 200 support on week TFBombay Dyeing has weak MACD and RSI indicator
It is forming Cypher M pattern as it has candles below lakshman rekha line.
Now it has major support at 200, if it close below 200 on weekly time frame then following targets possible.
Target 190/ 170/ 160/150
BOMBAY DYEING - Ready to Move to the Next OrbitThe stock after facing price rejection in the range of 224 to 241 was pushed down to the 50 DMA. It moved almost sideways in the last three months. Recently we saw some interest coming back into the stock with the relative strength and the money flow turning positive and the volume was also increasing. The stock remained very strong during the recent weakness we saw in the overall market. Now finally it has crossed above the price rejection zone with good volume support. The delivery volumes saw substantial increase recently. All other parameters like the buying pressure, volume adjusted momentums, absolute momentum everything seem to be favouring further up move. Looks like the stock is ready to move to the top into the next orbit.

BOMBAY DYEING - BUYNSE:BOMDYEING Weekly breakout stock with positive momentum of macd crossover and comparative analysis.

BOMBAY DYEING & MFG S/R for 25/6/24Support and Resistance Levels: In technical analysis, support and resistance levels are significant price levels where buying or selling interest tends to be strong. They are identified based on previous price levels where the price has shown a tendency to reverse or find support.
Support levels are represented by the green line and green shade, indicating areas where buying interest may emerge to prevent further price decline.
Resistance levels are represented by the red line and red shade, indicating areas where selling pressure may arise to prevent further price increases. Traders often consider these levels as potential buying or selling opportunities.
Breakouts: Breakouts occur when the price convincingly moves above a resistance level (red shade) or below a support level (green shade). A bullish breakout above resistance suggests the potential for further price increases, while a bearish breakout below support suggests the potential for further price declines. Traders pay attention to these breakout signals as they may indicate the start of a new trend or significant price movement.
Disclosure: I am not SEBI registered. The information provided here is for learning purposes only and should not be interpreted as financial advice. It is important to consult with a qualified financial advisor before making any investment decisions. Tweets neither advice nor endorsement.

bombay dyiengEstablished by Nowrosjee Wadia in 1879 as a small operation of Indian spun cotton yarn dip dyed by hand, Bombay Dyeing has now grown to be one of the most respected and trusted brands in the country.
Since the first store in 1879 and the only store manager, the growth has not only been in the company’s presence, but also in of how much it offers today. Stylish linens, towels, home furnishings, leisure clothing, kids wear and a whole blissful range of other products are now available across many exclusive Bombay Dyeing Retail or various Multi-brand stores.
All products come with our hallmark finish, great textures, detailed design to match the latest trends and fine quality which has been synonymous with Bombay Dyeing for over a century. Delivering the bet designer products at an outstanding value for money has always been our motto and forte.
Business area of the company
The company has a significant presence across textiles, real estate, aviation, foods and plantations, engineering & chemicals and healthcare. BDMC is engaged in home textiles, polyester and real estate busines

Buy Entry for Bombay DyeingAs per the SMC concept, the market needs more liquidity to break the Previous HIgh. Liquidity means the price should break the previous low,
In simple words, the market needs inducement to fuel the volume. In this chart, the price breaks the previous low and also sweeps liquidity. Now the market has a huge possibility to change its direction.
Now take buy entry.
SL: Below liquidy sweep candle low.
In case the market hit your SL. Don't panic Place your order on Extreme Demand Zone or OrderBlock.
Note: Don't invest blindly, check it meets your criteria and then take Decision.

BOMDYEINGThese are swing ideas which you can add your watchlist and analysis for yourself !
Keep on your radar!
This content only education purpose!
I am not sebi ragister!

BombaydyeingBuy
With stop loss of 131rs for the 1st target of 168rs
After breakout 2nd target is 285rs
For tip
I m dealing with
1.positional trade
2.swing trade
3.intraday trade
Note- don't deal in f&o,because my sL always hit
Feel free to contact 82696 13561

Bombay dyeing Bombay dyeing.. beautifully double bottom formed at major support level, now on verge of neck line breakout...150 is important level to look for..once cross and sustain then stock is ready to retest life time high level...keep adding small small qty

Bombay Dyeing Bombay Dyeing
C&H Formation on Yearly Basis.
Price BreakOut Needed & To be Sustained.
Strong Resistance @131. Need to Cross it.
Trail SL with Upside.
Book Profit as per Risk Appetite.
Do Your Own Research as well.
Happy Investing 😇

Bombay Dyeing-Nice breakoutBombay Dyeing-Nice breakout.
Capital to be deployed- 20k
Investing Price -120-122
Breakout Price -1116
Stoploss-97.75
Targets-151-202-224
#bombaydyeing #StocksToBuy #StockMarket #StockToWatch #StocksInFocus #stockstowatch

BREAKOUT STOCK ( DELIVERY )Bombay Dying Stock Which Is On Verge Of a Breakout Above 149 Levels ... Looks Good To Enter At Present Levels Of 137 Levels As It Has Given Breakout Of Its Upward Channel.Once The Stock Closes Above 149 The Upward Target Will Be 270/300. Stoploss At 100.

bombay dyeing - watchlong consolidation period coming to an end on monthly charts.
keep on watch, real estate demerger
for education purposes only.

BOMDYEING Levels...M Candle (30.12.2021)BOMDYEING now traveling in trend line and slightly completed in bearish hormonic pattern, will expect good momentum in 2022

triangular pattern formation in bombay dyienglooks bullish can have for positional trade.
bombay dyieng is making triangular pattern which can be breakout either side.

Bombay dyeing must for long term. look at the chart. the stock already broke out longer-term supply zone with very good volumes. must buy for me

Breakout from channelIt has BO'd from channel some time ago and today it moved up 9.8%...volumes are ok. Targets marked. This is not a recommnedation


BOMBAY DYEINGIndian govt came out with textile policy recently & US banned China textile
Pattern also looks bullish with short term and long term targets defined on charts.

bombaydyeing swing oppurtunityit has given strong weekly breakout and we can see further upmove tARGET 145

Keep buying for the target of 90Average it near 74.50, if it breaks average near 72.
If it breaks 71 exit please.

Bombay dyeing weekly chart Long
NSE:BOMDYEING
Entry SL mentioned in chart itself
Disclaimer: I am not a SEBI register person please contact your financial advisor before investing
