CAPLIN POINT - BUYNSE:CAPLIPOINT Weekly parabolic formation with macd and buyers may continue upward rally .
CAPLIPOINT trade ideas

CAPLIPOINT – Turning Point Ahead?CAPLIPOINT has been in a Stage 4 decline, but recent price action suggests a potential Stage 1 base. The stock bounced off ₹1785 support, with the 200-day MA acting as a key level.
Key Levels to Watch:
• Resistance: ₹1914, ₹2249 (trendline + moving averages).
• Breakout Zone: A strong close above ₹2250 could trigger a Stage 2 uptrend.
• Target: ₹2500-2600 if momentum builds.
Trade Plan:
• Aggressive entry: ₹1800-1850 with SL below ₹1780.
• Safe entry: Above ₹2250 with volume confirmation.
A breakout with strong volume could signal a trend reversal—one to watch!
📌 Disclaimer
For educational purposes only—do your own research before trading.

Caplin Point Laboratories - 2537.5Date:26-12-2024
Time: 12:12PM
CMP: 2,538
Report by : Mujadid Saad.
Evaluation of Caplin Point Laboratories Ltd for Long-Term Investment
1. Financial Health:
• Revenue Growth: Consistent revenue growth with a 5-year CAGR of 21% and a 10-year CAGR of 30%.
• Net Profit Margin: Strong at 33% in recent years, reflecting efficient operations.
• Debt-to-Equity Ratio: Virtually debt-free, which minimizes financial risk.
• Return on Equity (ROE): Excellent at 24% over the past year and consistent over the last decade (~26%).
• Free Cash Flow (FCF): Positive and growing, supporting sustainable expansion and dividends.
• Earnings Per Share (EPS): Steady growth; EPS increased from ₹1.85 in FY13 to ₹64.96 in FY24 (TTM).
• Dividend Payout: Low (~8–10%), indicating a focus on reinvestment.
2. Market Position:
• Strong presence in emerging markets like Latin America and Africa, with over 4,000 registered licenses.
• Differentiation through cost-effective manufacturing and extensive WHO-compliant product offerings.
• Growth in regulated markets like the US, showing adaptability.
3. Management and Governance:
• Proven leadership with a track record of sustainable growth.
• No reported major ethical controversies or litigation concerns.
• Corporate governance appears solid, with a focus on long-term shareholder value.
4. Industry Trends:
• Pharmaceuticals remain a growth industry with increasing demand in emerging and regulated markets.
• ESG factors are becoming more critical; Caplin's low-risk operations align well.
• Regulatory tailwinds, such as increased healthcare spending globally, support growth prospects.
5. Risk Analysis:
• Market Volatility: Limited, given the essential nature of products and geographical diversification.
• Operational Risks: Potential supply chain disruptions in emerging markets.
• Geopolitical Risks: Exposure to politically unstable regions may pose challenges.
6. Valuation:
• P/E Ratio: 39.1, slightly below industry peers, suggesting fair valuation.
• P/B Ratio: 7.59, indicating a premium for quality and growth potential.
• Valuation metrics suggest the stock is not undervalued but reasonably priced for its performance.
7. Performance Metrics:
• ROI & ROA: Strong performance metrics with an ROCE of 26.5% and consistent profit growth.
• CAGR: Stock price CAGR of 54% over the past 5 years, reflecting market confidence.
• Notable achievements in penetrating regulated markets and scaling operations efficiently.
Decision: Yes for Long-Term Investment
Justification:
• Robust financial health with consistent revenue and profit growth.
• Leadership in emerging markets and expansion into regulated markets.
• Strong return ratios (ROE, ROCE) and virtually no debt.
• Aligned with industry growth trends and ESG priorities.
• Reasonable valuation compared to peers.
- This document is purely for educational purpose. This is not any investment suggestion. Please do your own research before investing.

Caplin Point 25% upside potentialhey, here it is my weekend analysis, my weekend pick is caplin point, this stock recently break its 84 days consolidation phase and now it gives around 20 to 25% in a month.

SWING IDEA - CAPLIN POINT LABORATORIESCaplin Point Laboratories , a leading pharmaceutical company known for its strong presence in regulated and emerging markets, presents a promising swing trade opportunity based on the following technical factors:
Reasons are listed below :
2100 Resistance Break : The stock has decisively broken the 2100 resistance level, signaling strength and potential for further upside.
Head and Shoulder Pattern Breakout : A classic bullish reversal pattern, indicating a continuation of the uptrend.
Bullish Marubozu Candle : A strong bullish candle on the daily timeframe showcases significant buying interest and momentum.
Trading Above Key Moving Averages : The price is comfortably above the 50 and 200 EMAs on the daily timeframe, reinforcing the bullish sentiment.
Target - 2390 // 2600
Stoploss - daily close below 2060
DISCLAIMER -
Decisions to buy, sell, hold or trade in securities, commodities and other investments involve risk and are best made based on the advice of qualified financial professionals. Any trading in securities or other investments involves a risk of substantial losses. The practice of "Day Trading" involves particularly high risks and can cause you to lose substantial sums of money. Before undertaking any trading program, you should consult a qualified financial professional. Please consider carefully whether such trading is suitable for you in light of your financial condition and ability to bear financial risks. Under no circumstances shall we be liable for any loss or damage you or anyone else incurs as a result of any trading or investment activity that you or anyone else engages in based on any information or material you receive through TradingView or our services.
@visionary.growth.insights

Caplin Point Laboratories Ltd view for Intraday 4th Dec #CAPLIPOCaplin Point Laboratories Ltd view for Intraday 4th Dec #CAPLIPOINT
Resistance 2340. Watching above 2345 for upside movement...
Support area 2290 Below 2310 ignoring upside momentum for intraday
Support 2290 Watching below 2285 for downside movement...
Resistance area 2340
Above 2310 ignoring downside move for intraday
Charts for Educational purposes only.
Please follow strict stop loss and risk reward if you follow the level.
Thanks,
V Trade Point

CAPLIN POINT LAB LTD S/RSupport and Resistance Levels:
Support Levels: These are price points (green line/shade) where a downward trend may be halted due to a concentration of buying interest. Imagine them as a safety net where buyers step in, preventing further decline.
Resistance Levels: Conversely, resistance levels (red line/shade) are where upward trends might stall due to increased selling interest. They act like a ceiling where sellers come in to push prices down.
Breakouts:
Bullish Breakout: When the price moves above resistance, it often indicates strong buying interest and the potential for a continued uptrend. Traders may view this as a signal to buy or hold.
Bearish Breakout: When the price falls below support, it can signal strong selling interest and the potential for a continued downtrend. Traders might see this as a cue to sell or avoid buying.
20 EMA (Exponential Moving Average):
Above 20 EMA(50 EMA): If the stock price is above the 20 EMA, it suggests a potential uptrend or bullish momentum.
Below 20 EMA: If the stock price is below the 20 EMA, it indicates a potential downtrend or bearish momentum.
Trendline: A trendline is a straight line drawn on a chart to represent the general direction of a data point set.
Uptrend Line: Drawn by connecting the lows in an upward trend. Indicates that the price is moving higher over time. Acts as a support level, where prices tend to bounce upward.
Downtrend Line: Drawn by connecting the highs in a downward trend. Indicates that the price is moving lower over time. It acts as a resistance level, where prices tend to drop.
RSI: RSI readings greater than the 70 level are overbought territory, and RSI readings lower than the 30 level are considered oversold territory.
Combining RSI with Support and Resistance:
Support Level: This is a price level where a stock tends to find buying interest, preventing it from falling further. If RSI is showing an oversold condition (below 30) and the price is near or at a strong support level, it could be a good buy signal.
Resistance Level: This is a price level where a stock tends to find selling interest, preventing it from rising further. If RSI is showing an overbought condition (above 70) and the price is near or at a strong resistance level, it could be a signal to sell or short the asset.
Disclaimer:
I am not a SEBI registered. The information provided here is for learning purposes only and should not be interpreted as financial advice. Consider the broader market context and consult with a qualified financial advisor before making investment decisions.


SWING IDEA - CAPLIN POINT LABORATORIESCaplin Point Laboratories , a leading pharmaceutical company known for its focus on generic formulations with strong fundamentals, presents an attractive opportunity for swing traders and investors.
Reasons are listed below :
Support Zone at 1200-1250 : Caplin Point Laboratories has established a strong support zone in the range of 1200-1250, showcasing its resilience and attracting buying interest at these levels.
Bullish Hammer on Weekly Timeframe : A bullish hammer candlestick pattern observed on the weekly timeframe signals a potential reversal of the downtrend and indicates bullish sentiment among investors.
Bullish Engulfing on Daily Timeframe : The formation of a bullish engulfing candlestick pattern on the daily timeframe, engulfing ten previous daily candles, reinforces the bullish outlook and suggests a shift in momentum in favor of Caplin Point Laboratories.
0.5 Fibonacci Support : Finding support at the 0.5 Fibonacci level strengthens the bullish case and provides a solid foundation for potential upward movement.
Higher Highs : The stock has consistently formed higher highs, reflecting a trend of increasing bullish momentum and indicating potential for further upward movement.
Trading Above 50 and 200 EMA on Weekly Timeframe : Caplin Point Laboratories is trading above both the 50 and 200 Exponential Moving Averages (EMA) on the weekly timeframe, further confirming its bullish momentum.
Target - 1410 // 1540 // 1620
Stoploss - weekly close below 1207
DISCLAIMER -
Decisions to buy, sell, hold or trade in securities, commodities and other investments involve risk and are best made based on the advice of qualified financial professionals. Any trading in securities or other investments involves a risk of substantial losses. The practice of "Day Trading" involves particularly high risks and can cause you to lose substantial sums of money. Before undertaking any trading program, you should consult a qualified financial professional. Please consider carefully whether such trading is suitable for you in light of your financial condition and ability to bear financial risks. Under no circumstances shall we be liable for any loss or damage you or anyone else incurs as a result of any trading or investment activity that you or anyone else engages in based on any information or material you receive through TradingView or our services.
@visionary.growth.insights

CAPLIPOINT GIVES BRAKEOUT ON DAILY CHARTNSE:CAPLIPOINT
CAPLIPOINT gives brake out on daily chart
I am buying this stock
Near 1500
And follow sl on 1340
My target will be 1750
My risk reward ratio is 1:1.75
Return on capital 17%

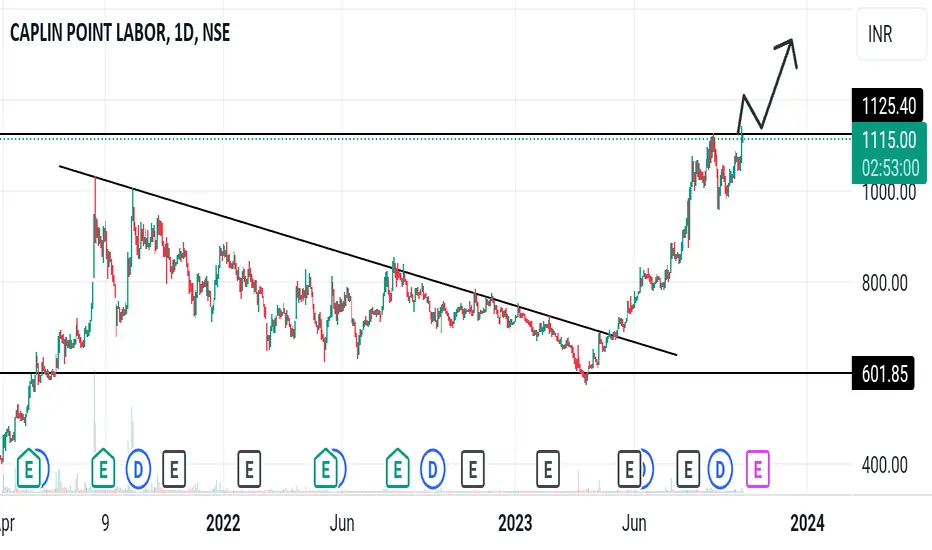
CaplipointStock has given good move, ready for a breakout above trendline.
Also cup and handle breakout can be seen.
Targets can be 1600-1800-1900
Disclaimer: only for education purposes, no buy or sell recommendation. we are not sebi registered. always discuss first with your financial advisors

Caplin point may test 1600+Caplin Point Laboratories Ltd is engaged in the manufacturing and sourcing of APIs, finished formulations, R&D, clinical research with presence in Latin America, Africa, USA and other nations.
Pharma sector in bull mode
Cmp 1488
stop 1450
target 1600
risk reward 1:2
Holding period 15days
after a good breakout retested 10Ema
bouncing up
volume also picks up

Caplipoint on a weekly timeframeCaplipoint on a weekly timeframe give storng breakout of all time high
Entry @ 1200
Sl @ 900

CaplinpointCMP: 1115
If stock price 1125 upper candle day closing And retest than see bullish movement See in future !
These are swing idea's which you can add your watchlist and analysis for yourself.
Keep on radar.
This content for only education purpose!
I am not SEBI Register.
Caplin point Breakout trading implementation:
1. **Identifying New Trends:** Breakout trading helps traders identify the beginning of new trends by focusing on price levels where an asset breaks out of its historical trading range.
2. **Volatility Indicator:** Breakouts often occur when there's increased volatility in the market. Monitoring breakouts can provide insights into shifts in market sentiment and potential price movements.
3. **Entry Points:** Breakout points serve as potential entry points for traders looking to ride the momentum of a newly established trend. Buying on a breakout can capture the early stages of a price movement.
4. **Confirmation of Strength:** Successful breakouts indicate the strength of a trend. If an asset breaks out with high volume and follows through with sustained price movement, it suggests a strong trend in that direction.
5. **Avoiding False Signals:** Breakout strategies often include using indicators or confirmation signals to avoid false breakouts. This can enhance the accuracy of trade decisions.
6. **Defined Risk and Reward:** Breakout trading allows for setting clear stop-loss levels below the breakout point, which helps manage risk. Traders can also calculate potential profits based on the distance between the breakout point and a projected target.
7. **Adaptable to Various Markets:** Breakout trading can be applied to various markets, including stocks, forex, commodities, and cryptocurrencies. The concept remains consistent across different assets.
8. **Flexibility:** Traders can adapt breakout strategies to their preferred timeframes, whether they are day traders, swing traders, or long-term investors.
9. **Liquidity Opportunities:** Breakout points are often associated with increased trading volume, which can provide better liquidity for executing trades.
10. **Risk vs. Reward Assessment:** Traders can evaluate the potential risk of a trade (stop-loss) against the potential reward (target price), aiding in decision-making and portfolio management.
11. **Psychological Advantage:** Successful breakout trades can boost a trader's confidence and discipline, reinforcing the effectiveness of their strategy.
12. **Market Events:** Breakouts can occur around significant market events such as earnings reports, economic data releases, or geopolitical developments, offering traders opportunities to capitalize on sudden price movements.
Remember, while breakout trading offers potential advantages, it also carries risks. False breakouts and market reversals can lead to losses. Successful implementation requires a solid understanding of technical analysis, risk management, and the ability to adapt to changing market conditions.


bullish on caplin point lab.in next three months it can touches 990 level it breaks the range and ready to move upward.

Resistance BreakoutPlease look into the chart for a detailed understanding.
Consider these for short-term & swing trades with 2% profit.
For BTST trades consider booking
target for 1% - 2%
For long-term trades look out for resistance drawn above closing.
Please consider these ideas for educational purpose

Caplin Point-Nice BreakoutCaplin Point-Nice Breakout
Capital to be deployed- 20k
Investing Price -860-870
Breakout Price -857
Stoploss -785
Targets - 1011-1206
#caplinpoint #StockMarketindia #StockToWatch #StocksInFocus #stockstowatch #StocksToTrade

Caplin PointWeekly closure above 818 is a good entry or wait for the retest of the Trendline and can enter
Delivered good results and technically looks good as well


Pharma Stock Alert: NSE:CAPLIPOINT Ready to BreakoutHello, fellow traders!
Today, we are going to look at NSE:CAPLIPOINT, a pharma sector stock that is ready to breakout. The NSE:CNXPHARMA broke its resistance in October and showed signs of going higher, but it has been consolidating for four months now.
Looking at the chart, we can see that the price is patiently approaching the mentioned price level, and the entry price for this stock is also at a bottom level. This presents a great opportunity for a long position in this stock, making it an ideal trading system.
Remember, the price is the "King of Market," and we cannot guarantee anything in the market. This view is for educational purposes only, and any stock mentioned here should not be taken as trading or investing advice. Please consult your financial advisor before investing, and always remember to manage your risk.
Thanks & regards,
Alpha Trading Station.

Caplin point looking weak
Stock is trading near support level
Also trading below 200 DMA
This support should act as the stoploss
