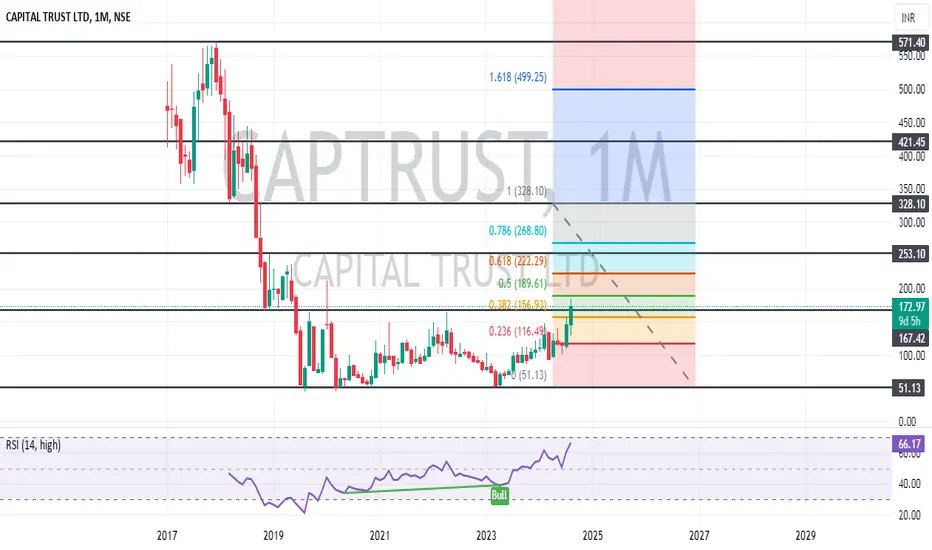
CAPTRUST Approaching Trendline Breakout – Watch Closely"CAPTRUST Breakout: Strong Weekly Close & Trendline Retest!"
✅ 5 Touches on Trendline – Strong validation of the breakout zone.
✅ Weekly Close with High Volume – Indicates strong buying interest.
✅ 1-Hour Reversal Candle – Early confirmation of momentum shift.
0.65 INR
11.11 M INR
960.00 M INR
12.54 M
About CAPITAL TRUST LTD
Sector
Industry
Website
Headquarters
New Delhi
Founded
1985
ISIN
INE707C01018
FIGI
BBG000DDQTX8
Capital Trust Ltd. is a holding company, which engages in the provision of non-banking financial business. Its products include microfinance loan, micro-enterprise loan, and secured-enterprise loan. The company was founded on August 23, 1985 and is headquartered in New Delhi, India.
Related stocks

Capital Trust LtdCapital Trust Ltd
Incorporated in 1985, Capital Trust Ltd provides loans to Small and Micro Enterprises
Company is registered as a Systematically Important Non Deposit Taking Non Banking Finance Company. It used to provide consultancy services to foreign banks and later began offering business loan

Technical Analysis of Capital Trust Ltd (CAPTRUST)Technical Analysis of Capital Trust Ltd (CAPTRUST)
Overview of the Stock:- The technical analysis on a weekly timeframe analysis of Capital Trust Ltd (CAPTRUST) on the National Stock Exchange (NSE) of India. The key indicators and patterns observed are:
1. Uptrend: The overall trend appears to
CAPTRUST - BUY ACTIVECAPTRUST- Capital Trust Limited - BUY ACTIVE
Chart Insights : Weekly Chart
Stock closed at 142 on 23-FEB-24
We can see stock is coming to break the resistance and can expect upside move if its sustain above the resistance.
BUY Active only on top of resistance , it may try to retest the same level in

SHORT TERM OPPORTUNITY IN CAPITAL TRUST_35% UPSIDEOn a day where almost every stock seemed to tumble, CAPTRUST managed to pull off a bullish stunt. The stock closed with a +15% gain along side 15 times surge in daily volume.
The weekly chart of the stock shows us that the stock managed to pierce above an18 months old active supply zone.
Since Jul


#CAPTRUST #NIFTY #BANKNIFTY #IoT #ML #CANDLESTICKS #TRADE ##CAPTRUST
Capital Trust Ltd.
CMP: 85.20 {Comment to know when to enter this trade!}
Target: 127 // 147 // 167
If u like my work, kindly LIKE SHARE & FOLLOW for latest stock recommendations.

See all ideas
Summarizing what the indicators are suggesting.
Oscillators
Neutral
SellBuy
Strong sellStrong buy
Strong sellSellNeutralBuyStrong buy
Oscillators
Neutral
SellBuy
Strong sellStrong buy
Strong sellSellNeutralBuyStrong buy
Summary
Neutral
SellBuy
Strong sellStrong buy
Strong sellSellNeutralBuyStrong buy
Summary
Neutral
SellBuy
Strong sellStrong buy
Strong sellSellNeutralBuyStrong buy
Summary
Neutral
SellBuy
Strong sellStrong buy
Strong sellSellNeutralBuyStrong buy
Moving Averages
Neutral
SellBuy
Strong sellStrong buy
Strong sellSellNeutralBuyStrong buy
Moving Averages
Neutral
SellBuy
Strong sellStrong buy
Strong sellSellNeutralBuyStrong buy
Displays a symbol's price movements over previous years to identify recurring trends.
Frequently Asked Questions
The current price of CAPTRUST is 66.82 INR — it has decreased by −3.05% in the past 24 hours. Watch CAPITAL TRUST LTD stock price performance more closely on the chart.
Depending on the exchange, the stock ticker may vary. For instance, on NSE exchange CAPITAL TRUST LTD stocks are traded under the ticker CAPTRUST.
CAPTRUST stock has fallen by −6.78% compared to the previous week, the month change is a −15.42% fall, over the last year CAPITAL TRUST LTD has showed a −48.89% decrease.
CAPTRUST reached its all-time high on Dec 1, 2017 with the price of 553.65 INR, and its all-time low was 43.14 INR and was reached on Mar 30, 2020. View more price dynamics on CAPTRUST chart.
See other stocks reaching their highest and lowest prices.
See other stocks reaching their highest and lowest prices.
CAPTRUST stock is 7.79% volatile and has beta coefficient of 8.49. Track CAPITAL TRUST LTD stock price on the chart and check out the list of the most volatile stocks — is CAPITAL TRUST LTD there?
Today CAPITAL TRUST LTD has the market capitalization of 1.53 B, it has decreased by −2.07% over the last week.
Yes, you can track CAPITAL TRUST LTD financials in yearly and quarterly reports right on TradingView.
CAPTRUST net income for the last quarter is 859.00 K INR, while the quarter before that showed 588.00 K INR of net income which accounts for 46.09% change. Track more CAPITAL TRUST LTD financial stats to get the full picture.
CAPITAL TRUST LTD dividend yield was 0.00% in 2024, and payout ratio reached 0.00%. The year before the numbers were 0.00% and 0.00% correspondingly. See high-dividend stocks and find more opportunities for your portfolio.
EBITDA measures a company's operating performance, its growth signifies an improvement in the efficiency of a company. CAPITAL TRUST LTD EBITDA is 41.34 M INR, and current EBITDA margin is 4.31%. See more stats in CAPITAL TRUST LTD financial statements.
Like other stocks, CAPTRUST shares are traded on stock exchanges, e.g. Nasdaq, Nyse, Euronext, and the easiest way to buy them is through an online stock broker. To do this, you need to open an account and follow a broker's procedures, then start trading. You can trade CAPITAL TRUST LTD stock right from TradingView charts — choose your broker and connect to your account.
Investing in stocks requires a comprehensive research: you should carefully study all the available data, e.g. company's financials, related news, and its technical analysis. So CAPITAL TRUST LTD technincal analysis shows the strong sell today, and its 1 week rating is sell. Since market conditions are prone to changes, it's worth looking a bit further into the future — according to the 1 month rating CAPITAL TRUST LTD stock shows the sell signal. See more of CAPITAL TRUST LTD technicals for a more comprehensive analysis.
If you're still not sure, try looking for inspiration in our curated watchlists.
If you're still not sure, try looking for inspiration in our curated watchlists.