CARERATING trade ideas

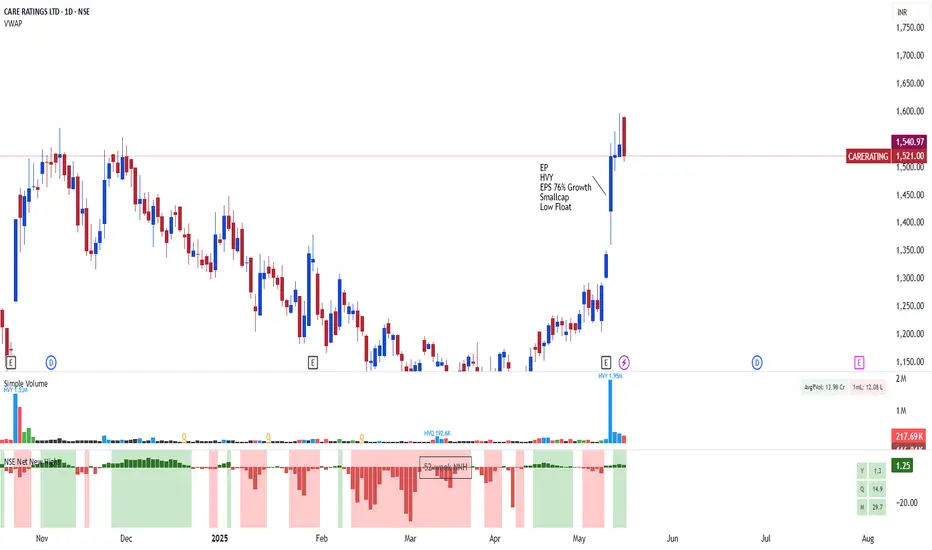
Care Rating - EP / HVY
EP
HVY
Gapup
EPS 76% Growth
Smallcap
Low Float
Margin Improvement
All Time High
Look for low risk entry before making position
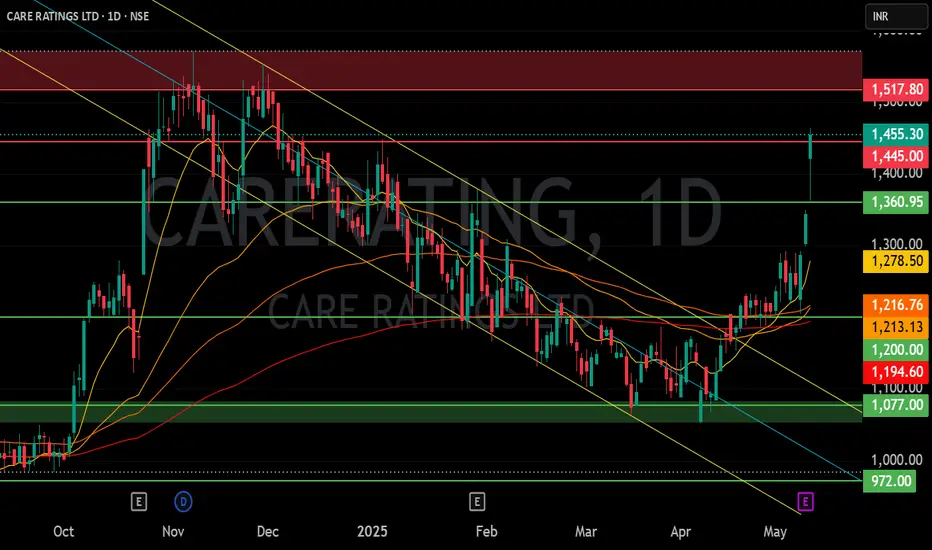
Equity Research Report – CARE Ratings Ltd (CARERATING)🔹 Technical Outlook
Stock has broken out of a horizontal resistance near ₹1,237 with volume pickup.
RSI is above 60, indicating momentum strength.
Short-term EMAs are crossing over the 50-day EMA — bullish signal.
Volume confirms accumulation.
🛒 Trade Setup
✅ Short-Term View (Swing/Positional Trade):
Buy above: ₹1,240 (on closing basis)
Target 1: ₹1,320
Target 2: ₹1,375
Stop-Loss: ₹1,185
Timeframe: 2–4 weeks
🏦 Long-Term View (Investor Strategy):
Buy Range: ₹1,180–1,240
Target 1: ₹1,450
Target 2: ₹1,580
Stop-Loss: ₹1,080 (weekly close)
Timeframe: 3–6 months
for educational purpose only

CARE RATINGS LTD S/RSupport and Resistance Levels:
Support Levels: These are price points (green line/shade) where a downward trend may be halted due to a concentration of buying interest. Imagine them as a safety net where buyers step in, preventing further decline.
Resistance Levels: Conversely, resistance levels (red line/shade) are where upward trends might stall due to increased selling interest. They act like a ceiling where sellers come in to push prices down.
Breakouts:
Bullish Breakout: When the price moves above resistance, it often indicates strong buying interest and the potential for a continued uptrend. Traders may view this as a signal to buy or hold.
Bearish Breakout: When the price falls below support, it can signal strong selling interest and the potential for a continued downtrend. Traders might see this as a cue to sell or avoid buying.
MA Ribbon (EMA 20, EMA 50, EMA 100, EMA 200) :
Above EMA: If the stock price is above the EMA, it suggests a potential uptrend or bullish momentum.
Below EMA: If the stock price is below the EMA, it indicates a potential downtrend or bearish momentum.
Trendline: A trendline is a straight line drawn on a chart to represent the general direction of a data point set.
Uptrend Line: Drawn by connecting the lows in an upward trend. Indicates that the price is moving higher over time. Acts as a support level, where prices tend to bounce upward.
Downtrend Line: Drawn by connecting the highs in a downward trend. Indicates that the price is moving lower over time. It acts as a resistance level, where prices tend to drop.
Disclaimer:
I am not a SEBI registered. The information provided here is for learning purposes only and should not be interpreted as financial advice. Consider the broader market context and consult with a qualified financial advisor before making investment decisions.

careStandalone financials highlights for the first half of FY25 reported a revenue of Rs 101.51 crore, up 19% year-on-year basis, ebitda was at Rs 56.92 crore, up 26% on y-o-y basis and profit after tax stood at Rs 49.64 crore, up 22% y-o-y.

CARERATING CMP 1230.In 2013 stock make a bottom 400 level. Then give a sharp rally till 1700 levels.Then again touched 1700 levels but not break it. Then contineusly going down and again make bottom at 400 levels an consolidate this area till 2023.And make a short term rally at 1200 and forming a CUP and Handle Pattern.Monthly RSI above 65+ indicating a strong buy .Macd line and Macd signal above 100. This months candle made a strong White Morubozzu. Add this to your wachlist and find your best Risk Reward and Entry Exit. Thanks.

Strong Weekly Close This stock closed very strongly on weekly chart with huge volume mainly supported by excellent results. What is more interesting is the stock is just under 20% below to reach its all-time high.
good time to add to watchlist.

Channel pattern on CARERATINGCARERATING is trading within a rectangular pattern or channel. I was supposed to post this one last night and didn't realize today was a trading day at NSE. Entry could be at the bottom of channel and exit at the top end of channel. Could be an easy 7 to 8% profitable trade if done rite. Stop loss can be kept at either end of the channel depending on what direction you take.
Hope you liked this idea, if so please boost this idea so others could benefit or leave a comment on what you think. I'll be glad to hear from you. Otherwise happy trading :-)


Care ratingCare rating ltd. Double bottom formed at base level..last month neckline breakout of double bottom, add more if sustain above 1000 level for 2-3 week for the target of 1600. CMP:857 stoploss:700(wcb)

Long for CARERATING Stock trading above 50 EMA at monthly chart pattern. It may be trade till 950 in next 1-2 month and get almost 250 points.

Triangle Pattern BreakoutPlease look into the chart for a detailed understanding.
Consider these for short-term & swing trades with 2% profit.
For BTST trades consider booking
target for 1% - 2%
For long-term trades look out for resistance drawn above closing.
Please consider these ideas for educational purpose

CARERATING - Demand emerged at 400-550 in Jun-22/Jul-22/Aug-22After approximately 50% drop from 750 to 400
Further, price has held higher with lesser volume
Plan
- Consider to Buy above 550
- and/ or Rejections near 400
PB 2x
PE 19x
ROCE 16%
DivYld 3%

this stock is ready to blast...(TMT) CARE rating (close 512.60):- Reversed from trend line support zone again, now 470 strong support zone if not break then expected 800+ ...

Care Rating - BullishExpecting a Big Breakout near 490-500 area
May give proper pullback before edging higher
Keep an eye


A BULLISH MOVE IS BEING EXPECTED IN CARERATINGCARERATING seems to look positive on the chart, currently at around 615.
It is being expected that the stock can initially face a Resistance at around the levels of 651, 678 and 720. Whereas on the downside levels, it can face a support at around the level of 602 on a closing basis.
Disclaimer: No financial information whatsoever published here, should be construed as an offer to buy or sell securities, or as advice to do so in any way whatsoever. All matter published here is purely for Educational and Information purposes only and under no circumstances should be used for making investment decisions. Viewers must consult their personal financial advisor before making any actual investment decisions, based on information published here. Any Investor or Trader taking decisions based on any information published here, does so entirely at its own risk. Investors and Traders should bear in mind that any investment in Stock Market is subject to unpredictable market-related risks.


Care Ratings: Buy for 14% profitBuy Care ratings ,
Currently at 767.5 .
Keep stop loss at 690 on daily closing basis. Target will be 880 which is 14.7% up from current levels.
Keep a view of at least 3 months and buy.
**Ideas are my own**Take risk as per your risk taking ability**

Beautiful Chart Pattern With demand and Supply ZoneBeautiful Chart Pattern With demand and Supply Zone

