CARTRADE trade ideas
Cartrade Tech LtdCarTrade Tech Ltd is a multi-channel auto platform provider company with coverage and presence across vehicle types and Value Added Services. The company operates various brands such as CarWale, CarTrade, Shriram Automall, BikeWale, CarTradeExchange, Adroit Auto, and AutoBiz. The platform connects new and used automobile customers, vehicle dealers, vehicle OEMs, and other businesses to buy and sell different types of vehicles. The company offers a variety of solutions across automotive transactions for buying, selling, marketing, financing, and other activities.
Market Cap
₹ 9,022 Cr.
Current Price
₹ 1,900
Stock P/E
67.2
Book Value
₹ 468
Dividend Yield
0.00 %
ROCE
7.60 %
ROE
6.26 %
Face Value
₹ 10.0
Price to book value
4.06
Intrinsic Value
₹ 709
PEG Ratio
1.20
Price to Sales
14.1
Debt
₹ 131 Cr.

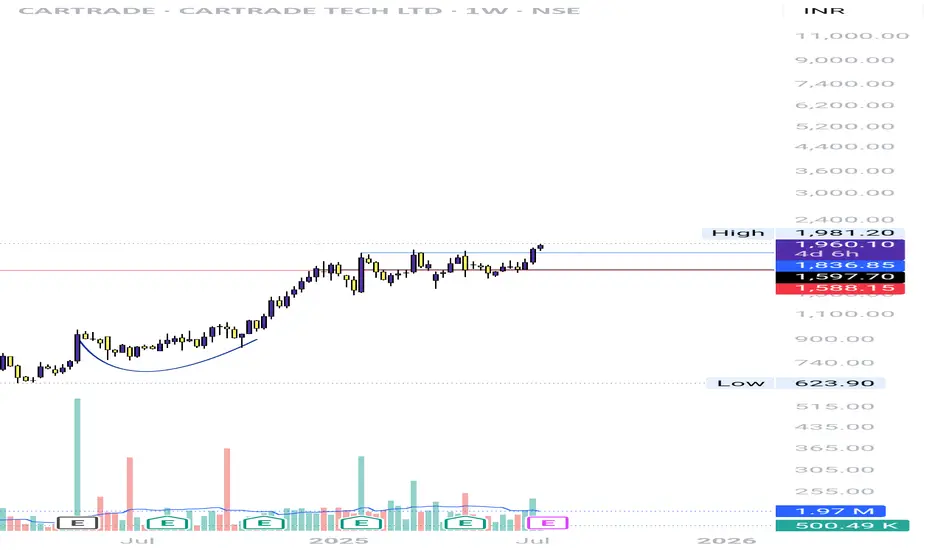
Long Cartrade Tech LTD . This stock has broken out of a rectangle pattern and trending at 1899.70. We can take a swing trade in this stock with an SL of 7.5% which will hit at 1750 and target of 22% which we will achieve at 2320. Our risk & reward ratio is 1:3.
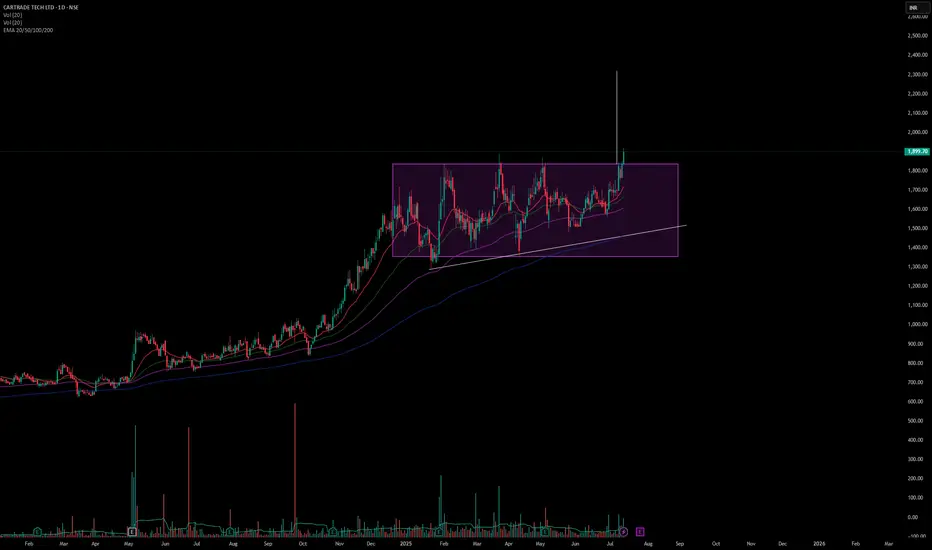
CARTRADE - Ready for its next leg upAfter setting up a nice base, CarTrade is finally looking to move up. Good consolidation in the last few months. Breakout looks clean and the volumes are excellent too!
SL - 1650

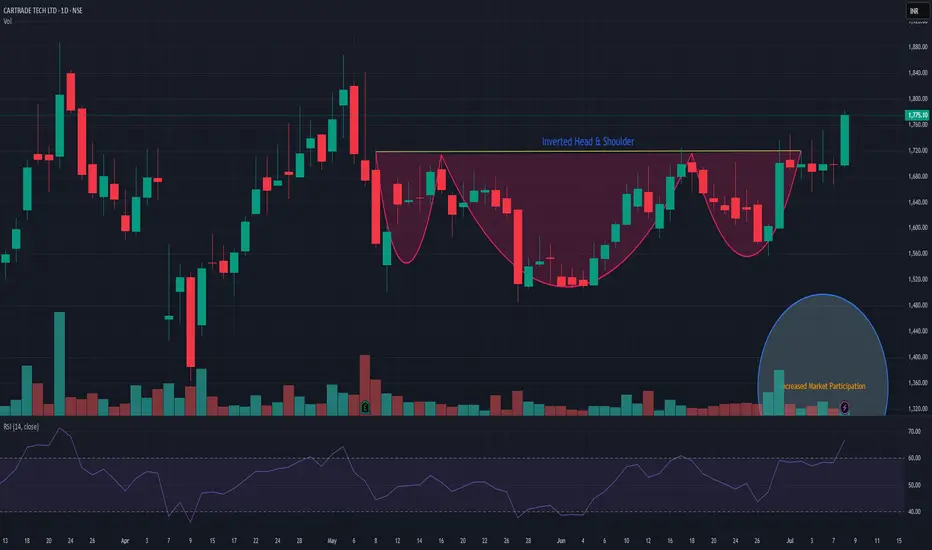
CARTRADECARTRADe is showing strength and has given Inverted head & Shoulder breakout with decent market participation. support is near 1620. It has a potential to go up! Keep it on radar. Closing below 1620 may change my view.
Cup and handle pattern in CartradeCup and handle pattern observed in Cartrade. The handle is of sideways action with decreasing volume during handle progression suggesting sellers are drained out and buyers are taking control. Sustainable breakout might be observed.

CarTrade Strong Breakout with Retest Opportunity📈 NSE:CARTRADE 🚗 - Strong Breakout with Retest Opportunity!
🔹 Current Price: ₹1,694.95 (-4.94%)
🔹 Key Support Zone: ₹1,500-1,600 (Buy near this level)
🔹 Target Price: ₹2,459 (54.33% potential upside)
✅ Stock broke out of a trendline resistance
✅ Retesting breakout zone – potential buying opportunity
⚠️ Watch for support holding before entering positions
📢 Traders, this could be a great entry for a high-reward trade!

Cup with Handle Patter in Catrade AND All Time High breakoutAs you can see: The day cartrade listed it started going down. it has formed a curved bottom and handle(The cup and handle pattern) Broke out retested and broke out AGAIN. PURFECT BUY

CAR TRADE TECH BULLISHCar trade tech looks very strong after breaking ATH
also stock has made u - pattern
so one can go long with the target of 2903 with stop 1445

52 Week High Breakout - Positional Trade - Long TermDisclaimer: I am not a Sebi registered adviser.
This Idea is publish purely for educational purpose only before investing in any stocks please take advise from your financial adviser.
52 Week Breakout. Stock has Crossed 52 week High. Keep in watch list. Buy above the high. Suitable for Positional Trade. Stop loss & Target Shown on Chart. Stop loss Trail by 30 SMA. Exit if Price Close below 30 SMA on Weekly Chart.
Be Discipline because discipline is the Key to Success in the STOCK Market.
Trade What you see not what you Think.

CARTRADE TECH LTD S/R Support and Resistance Levels:
Support Levels: These are price points (green line/shade) where a downward trend may be halted due to a concentration of buying interest. Imagine them as a safety net where buyers step in, preventing further decline.
Resistance Levels: Conversely, resistance levels (red line/shade) are where upward trends might stall due to increased selling interest. They act like a ceiling where sellers come in to push prices down.
Breakouts:
Bullish Breakout: When the price moves above resistance, it often indicates strong buying interest and the potential for a continued uptrend. Traders may view this as a signal to buy or hold.
Bearish Breakout: When the price falls below support, it can signal strong selling interest and the potential for a continued downtrend. Traders might see this as a cue to sell or avoid buying.
MA Ribbon (EMA 20, EMA 50, EMA 100, EMA 200) :
Above EMA: If the stock price is above the EMA, it suggests a potential uptrend or bullish momentum.
Below EMA: If the stock price is below the EMA, it indicates a potential downtrend or bearish momentum.
Trendline: A trendline is a straight line drawn on a chart to represent the general direction of a data point set.
Uptrend Line: Drawn by connecting the lows in an upward trend. Indicates that the price is moving higher over time. Acts as a support level, where prices tend to bounce upward.
Downtrend Line: Drawn by connecting the highs in a downward trend. Indicates that the price is moving lower over time. It acts as a resistance level, where prices tend to drop.
Disclaimer:
I am not a SEBI registered. The information provided here is for learning purposes only and should not be interpreted as financial advice. Consider the broader market context and consult with a qualified financial advisor before making investment decisions.

CARTRADE CMP 1060DIWALI Pick. Cartrade making rounding bottom pattern. And trading at 52 week high zone.Trading above all moving averages.We can see a Long term Potential uptrend on this counter.Volumes are increasing with Bollinger Upper Band Breakout. We can see a good Risk and Reward in these levels. Find your best Entry Exit area and Enjoy Diwali Thanks.
SWING IDEA - CAR TRADE TECHCarTrade Tech is showing a promising swing trade setup based on the following key technical signals.
Reasons are listed below :
Break of Cup and Handle Pattern : The price is attempting to break out of a classic cup and handle pattern, which is a strong bullish continuation signal.
950 Zone Tested Multiple Times : The 950 zone has been tested repeatedly, indicating it is a strong resistance level. A breakout above this level could result in further upward momentum.
VCP Pattern in Uptrend : A Volatility Contraction Pattern (VCP) is forming, which suggests tightening price action and may lead to a breakout if volatility decreases and buying pressure increases.
Bullish Engulfing Candle on Weekly Timeframe : A bullish engulfing candle on the weekly chart reinforces the potential for an upward move, showing strong buying interest.
Increase in Volumes : A noticeable spike in volumes supports the bullish sentiment and confirms that market participants are actively involved in this move.
Higher Lows : The lows are consistently shifting higher, indicating sustained buying pressure and upward momentum.
Target - 1110 // 1210 // 1400
Stoploss - weekly close below 750
DISCLAIMER -
Decisions to buy, sell, hold or trade in securities, commodities and other investments involve risk and are best made based on the advice of qualified financial professionals. Any trading in securities or other investments involves a risk of substantial losses. The practice of "Day Trading" involves particularly high risks and can cause you to lose substantial sums of money. Before undertaking any trading program, you should consult a qualified financial professional. Please consider carefully whether such trading is suitable for you in light of your financial condition and ability to bear financial risks. Under no circumstances shall we be liable for any loss or damage you or anyone else incurs as a result of any trading or investment activity that you or anyone else engages in based on any information or material you receive through TradingView or our services.
@visionary.growth.insights

CARTRADE Breakout happend in this stock with rising 200dma and RS indicator is also showing strength.
Keep your risk and reward ratios according to your own preferance.
This is for educational purpose, do your own research before investing.

CARTRADE potential breakout 3 month long base
Volatility Contraction Pattern
Low Risk Entry Point
Recently posted good quarterly earnings

Indian Hume Pipe Company LtdIndian Hume Pipe Company Ltd
The Indian Hume Pipe Co. Ltd. was incorporated in 1926. The Company is in the business of manufacturing, laying and joining of pipelines. The Company has also been undertaking infrastructure development programmes by way of execution on turnkey basis the combined water supply projects. The company also manufactures and supplies Concrete Railway Sleepers to Indian Railways.

CARTRADE (Weekly Hidden Bullish divergence)CARTRADE is showing some big accumulation and expected to move further up to 1100-1500
NOTE: I'm not a SEBI REG. Study before investing.

Cartrade WeeklyCartrade Tech Ltd (Weekly)
Cmp - 935
Multi Year resistant break
Breakout with Volume Spurt
Safe Entry after retest of resistance zone
Disclaimer : For Educational purpose only
No Buy Sell recommendation

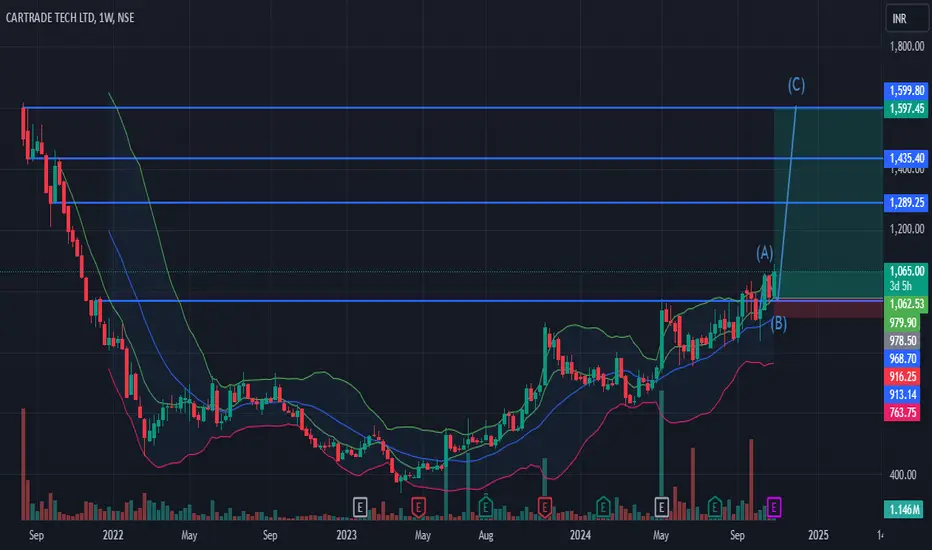
CARTRADE - Bullish SetupStock name - Cartrade Tech Limited.
Weekly chart setup
Chart is self explanatory. Levels of breakout, possible up-moves (where stock may find resistances) and support (close below which, setup will be invalidated) are clearly defined.
Master Score - A
Disclaimer: This is for demonstration and educational purpose only. this is not buying and selling recommendations. I am not SEBI registered. please consult your financial advisor before taking any trade.

Cartrade Tech LtdCartrade Tech Ltd
CarTrade Tech Ltd is a multi-channel auto platform provider company with coverage and presence across vehicle types and Value Added Services. The company operates various brands such as CarWale, CarTrade, Shriram Automall, BikeWale, CarTradeExchange, Adroit Auto, and AutoBiz. The platform connects new and used automobile customers, vehicle dealers, vehicle OEMs, and other businesses to buy and sell different types of vehicles. The company offers a variety of solutions across automotive transactions for buying, selling, marketing, financing, and other activities.
(I am not well-versed in the fundamentals of this company, but from a technical analysis perspective, the chart pattern appears to be strongly bullish. Similar patterns have led to substantial returns in other stocks previously. Let's observe whether this stock follows suit)

CARTRADEStock is giving technically gud entry with very low risk reward ratio.
SL 670
supported by both the key moving averages in daily time frame.
It may go to its all time high. it has the potential to reach its potential.
Risk reward ratio and probability is only the holy grail in the market.
Dont lose more than your entry reason.

CARTRADEAfter long time cartrade making gud price action after its ipo this stock is going continously down side. This is first time it is bottoming out.
either it may be clear break out but always keep risk reward ratio in mind.
sl and target is given on the chart.

CARTRADENSE:CARTRADE
Volume breakout
Sipport 714
SL- 694
Rsi>40
Sma 50 showing Buy
Initiate trade if sustain above 743
one year target may touch 1000
