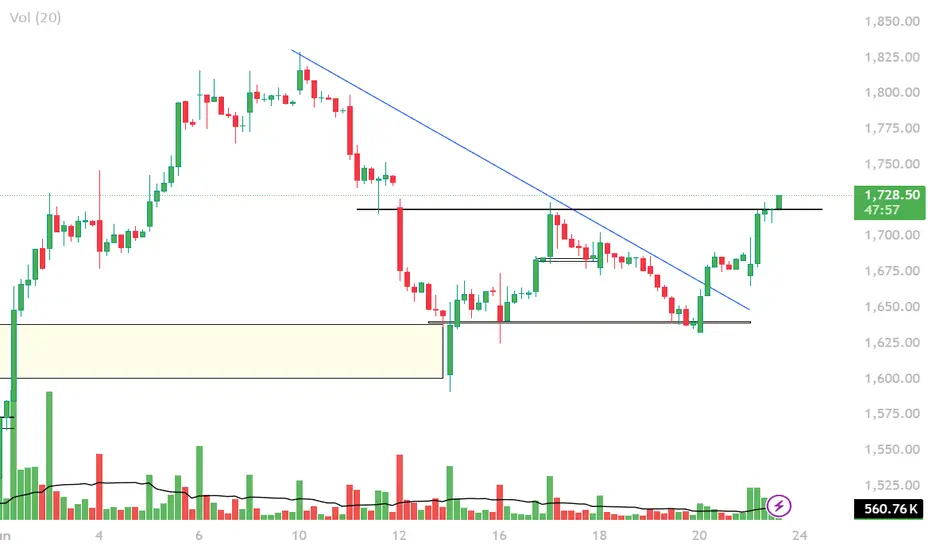
CDSL makes an Inverted H&S : A short term opportunityHi People
One of the most overhyped and a monopoly scrip just made a an Inverted Head and Shoulder pattern on 15 mins, which is an Bullish reversal pattern. The Stock broke the neck of the pattern and now resting on a crucial level of 1730 Rs.
Do understand that this is not a long term investment opportunity and just an short term trade as the stock is currently trading and an inflated PE ratio.
Breakout at 1730 level could fuel further movement in the stock and gives a swing trade/ intraday trade opportunity.
Disclaimer:- This analysis is just for educational purpose and doesn't guarantee profits. Do consult your financial adviser befor investing
CDSL trade ideas

CDSL MOVING TOWARDS NEW HIGHin coming weeks CDSL may create a new high, it is in the last leg to complete the C&H.

CDSL Breakout from the good zone The stock consolidated very well and facing 2-3 rejection there is change in nature of the stock
next high is the target
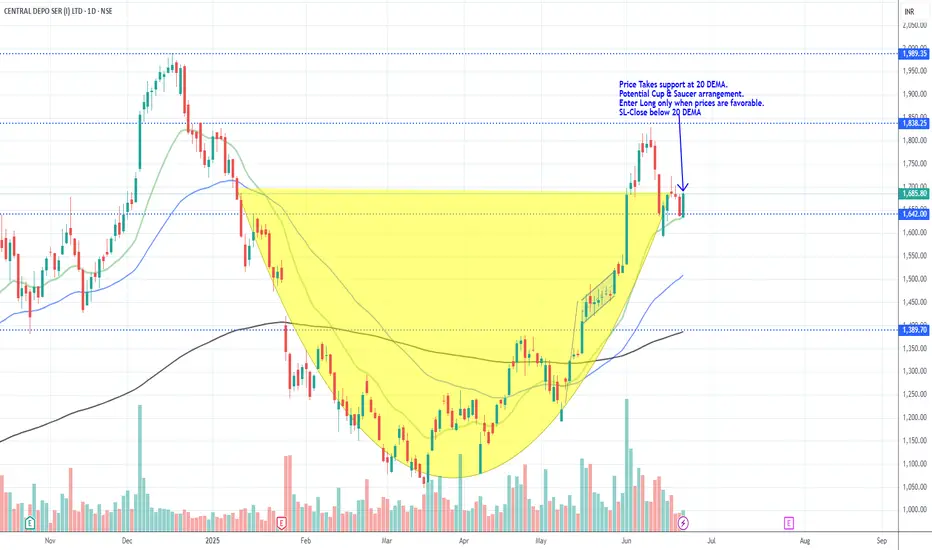
CDSL_Cup & Saucer_Support @ 20 DEMA_LongPrice Takes support at 20 DEMA.
Potential Cup & Saucer arrangement.
Enter Long only when prices are favorable.
SL-Close below 20 DEMA
CDSL - 20% Move from here on Valid Rounding bottom structure formed in this chart. Making Higher Highs near to all time high expecting min 30%+ in one year 💥💥

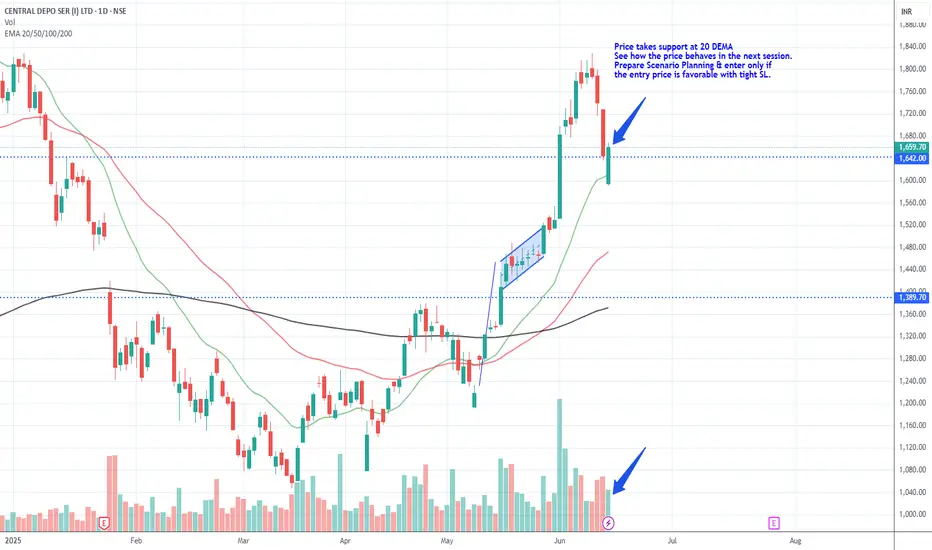
CDSL_Potential Re-entry pointPrice takes support at 20 DEMA
See how the price behaves in the next session.
Prepare Scenario Planning & enter only if
the entry price is favorable with tight SL.
CDSL – Rounding Bottom Breakout After DowntrendSummary
CDSL has broken out of a multi-month rounding bottom formation, reclaiming the key resistance level near ₹1396 with a wide-range candle and strong volume.
This move may signal the start of a trend reversal after a prolonged downtrend. If the breakout sustains, the projected target based on the depth of the base is around ₹1609 — approximately 24.5% upside from current levels.
Technical Highlights
Pattern: Rounding bottom (not a classic cup since no prior uptrend)
Breakout Level: ₹1396
Target: ₹1609 (based on breakout projection)
RSI: Rising to 66+, showing strengthening momentum
Volume: Highest in weeks, suggesting accumulation
Strategy
Entry: On breakout or retest of ₹1396
Target: ₹1600–1610
Stop: Below ₹1385
Disclaimer
This analysis is for informational and educational purposes only and should not be considered financial advice. Please conduct your own research and consult a qualified financial advisor before making any investment decisions.

Review and plan for 3rd June 2025Nifty future and banknifty future analysis and intraday plan.
This video is for information/education purpose only. you are 100% responsible for any actions you take by reading/viewing this post.
please consult your financial advisor before taking any action.
----Vinaykumar hiremath, CMT

CDSL Stock Analysis (as of May 26, 2025)CDSL Stock Analysis (as of May 26, 2025)
Key Observations:
• Current Price: ₹1,462.30 (+0.47%)
• Day’s Range: ₹1,445.00 (Low) – ₹1,474.70 (High)
• Volume: 42M (indicating moderate activity)
• RSI (14, High): 66.79 (approaching overbought but not extreme)
________________________________________
Trend Analysis:
1. Short-Term Trend (1D Chart):
o Bullish – The stock is trading above key moving averages, with higher highs and higher lows.
o Resistance (Short-Term): ₹1,474.70 (Today’s High) → Breakout above this could target ₹1,500.
o Support (Short-Term): ₹1,445 (Today’s Low) → A drop below may test ₹1,420-1,435.
2. Long-Term Trend (Weekly/Monthly):
o Uptrend Intact – The stock has been consolidating between ₹1,320-₹1,474. A breakout above ₹1,475 could signal a strong bullish continuation.
o Major Support (Long-Term): ₹1,372 (Key Swing Low) → A breakdown below this may shift trend to neutral/bearish.
________________________________________
Trade Setup:
Buy Entry (Long Trade):
• Ideal Entry: Near ₹1,445-₹1,435 (if retested with RSI cooling off).
• Confirmation: Bounce from support with volume increase.
• Target: ₹1,474 → ₹1,500 (Breakout Zone).
• Stop Loss: Below ₹1,420 (Risk Management).
Sell Entry (Short Trade – Caution Advised):
• If Rejection at ₹1,474-₹1,475: Short with tight stop above ₹1,480.
• Target: ₹1,445 → ₹1,420.
• Stop Loss: ₹1,485 (Only if RSI shows reversal signs).
________________________________________
Conclusion:
• Bias: Bullish as long as price holds above ₹1,435.
• Aggressive Traders: Can consider buying dips with proper risk management.
• Conservative Traders: Wait for a confirmed breakout above ₹1,475 for stronger upside.
RSI Note: At 66.79, the stock is near overbought but not extreme. A pullback to reset RSI could offer a better entry.
Final Verdict: Buy on Dips (₹1,435-₹1,445) for a rally towards ₹1,500.
________________________________________
Disclaimer: This is not financial advice. Always conduct your own analysis before trading. We are not responsible for your loss. Do your own research before buying this stock.

CDSL Chart Analysis – What’s Next After the Breakout?📊 Technical View:
CDSL has shown a strong breakout above the ₹1350–₹1370 resistance zone.
🔍 What should we watch for next?
🔹 Possible Retest: The price may pull back slightly to retest the breakout zone around ₹1350–₹1400, which could act as a solid support before the next move up.
🔹 Volume Confirmation: The breakout was supported by decent volume, adding strength to the bullish structure.
📌 Conclusion:
CDSL looks ready for a potential medium-term rally, backed by solid fundamentals and a breakout-backed chart setup. A healthy pullback might offer a great risk-reward opportunity.
📢 Disclaimer: This analysis is for educational purposes only. Please consult your financial advisor before making any investment decisions.

CENTRAL DEPO SER (I) LTD – Supply Zone Test Price has entered a major supply zone (₹1,390–₹1,440). Strong BOS (Break of Structure) confirms bullish momentum. RSI supports strength; breakout looks likely on volume surge.📌 Trade Plan (Swing/Positional):
Buy above: ₹1,445 (on breakout + closing basis)
Stoploss: ₹1,365
Target 1: ₹1,580
Target 2: ₹1,720
Sell Below (Rejection): ₹1,360 (if price gets rejected at supply)
🔍 Technical Highlights:
BOS and CHoCH indicate structure shift from bearish to bullish
Currently testing supply zone after BOS
Volume increasing with bullish candles
RSI approaching overbought — breakout likely, but confirmation needed
For Education Purposes Only

Cup & Handle Pattern and Inverse Head & Shoulder Breakout - CDSLTechnical Analysis:
Current Price: ₹1408.8 (Note: Live prices can fluctuate. As of the market close on May 16, 2025, CDSL closed around ₹1417.00 on the NSE).
Target: Your target of ₹1800 suggests a significant potential upside.
Cup & Handle Pattern Breakout: This bullish continuation pattern, if confirmed, indicates potential for a strong upward move.
Inverse Head & Shoulder Breakout: This is a bullish reversal pattern, suggesting the end of a downtrend and the start of an uptrend. The confluence of these two bullish patterns adds strength to the potential upside.
Time Frame: A 1 to 3-month timeframe is reasonable for these patterns to play out, assuming the breakouts are sustained.
Confirming the Breakouts:
Volume: It's crucial to assess if both breakouts were accompanied by a noticeable increase in trading volume. Strong volume adds conviction to the validity of the breakouts.
Sustainability: Monitor if the price holds above the breakout levels in the coming trading sessions.
Potential Upside:
Target (₹1800): Represents a potential upside of approximately 27.8% from the ₹1408.8 level (or around 26.9% from the ₹1417.00 closing price).
Quarterly and Yearly Results & EPS Comparison:
Latest Quarter Result (March 2025): CDSL reported a consolidated net profit of ₹100.31 Crore, a decrease of -22.4% compared to the same quarter last year (March 2024). The total income for the quarter was ₹255.78 Crore, a decrease of -4.34% YoY.
Yearly Result (FY2025): For the full fiscal year ending March 2025, CDSL's total revenue stood at ₹984.58 Crore, a growth of 32.53% compared to the previous fiscal year (FY2024). The profit after tax for FY25 was ₹462.10 Crore, a growth of 27.19% YoY.
EPS Comparison:
Quarterly EPS (March 2025): ₹3.86, compared to ₹4.66 in March 2024.
Yearly EPS (FY2025): ₹22.11, compared to ₹34.77 in FY2024. The yearly EPS shows a decrease despite revenue and profit growth, which could be due to an increase in the number of outstanding shares or other accounting adjustments.
P/E Comparison:
Based on the closing price of ₹1417.00 and the TTM (Trailing Twelve Months) EPS of approximately ₹25.20, the current P/E ratio is around 56.23.
Comparing this to peers like Computer Age Management Services (CAMS) with a P/E of around 43.73 and KFin Technologies with a P/E of around 55.97 (as of recent data), CDSL's P/E is in a similar range or slightly higher than some peers.
Corporate Action:
Dividend: CDSL has declared a final dividend of ₹12.50 per share for the fiscal year ending March 31, 2025, subject to shareholder approval. The ex-dividend date and payment date will be announced later.
In the quarter ending March 2024, CDSL declared a dividend of ₹3 per share.
Key Factors to Monitor:
Breakout Confirmation: Watch for sustained price action above the breakout levels with good volume for both the Cup & Handle and Inverse Head & Shoulder patterns.
Earnings Impact: Analyze how the market reacts to the recent quarterly and yearly results. While the yearly revenue and profit showed growth, the decrease in quarterly profit and yearly EPS might be a point of concern for some investors.
Market Sentiment: Overall market sentiment and the performance of the financial services sector will influence CDSL's price.
Dividend Announcement: Keep an eye on the record date and payment date for the declared dividend.

CDSL Ready To Break-Out On Upside!!CDSL is trading just below 200 Day Moving Average(DMA) 1426.
It is trading above 100, 50, & 20 DMAs.
Considering the overall upward momentum in the market to continue, we may expect CDSL to take out 200DMA and move above.
The immediate short-term (up to 3months) we may expect CDSL to move towards1426/1475/1518).
In medium-term (upto 6 months)1629 is a possibility.
In Long-Term (6months+ ), one can expect stock to take out the previous life time high of 1989 and move higher.
CDSL at Resistance?CDSL looks strong after a break out.
Entering a resistance zone around 1450
Potential reversal zones are at: 1520, 1620, & 1720!
Watch out!
Disclaimer: Not a buy / sell recommendation.

CDSL Stocks Analysis | Strong Resistance Zone & Breakout WatchCDSL (Central Depository Services Limited) is showing an interesting setup on the charts. After a recent correction, the stock is now approaching a resistance zone near ₹1362 , with signs of bullish pattern. 📉➡️📊
A potential breakout above ₹1370 could trigger bullish momentum. Keep an eye on volume and RSI for confirmation.
Key Levels to Watch:
Support: ₹1272
Resistance: ₹1362-1370
Trend: Neutral to Bullish (if breakout confirmed)
💬 What’s your view on CDSL? Are you bullish or waiting for more confirmation?
#CDSL #StockMarketIndia #TradingViewIndia #TechnicalAnalysis #BreakoutStocks #NSEStocks #SwingTrading #CDSLAnalysis #IndianStockMarket #Investing #StockChart

CDSLCDSL
MTF MTF-Zone TREND MTF Analysis Logic Average
HTF Yearly UP CDSLYearly Demand BUFL 903
HTF Half-Yearly UP CDSL6 Month Demand RR 1,146
HTF Qtrly UP CDSLQtrly Demand BUFL BUFL 923
HTF Average UP 990
MTF Monthly UP CDSLMonthly Demand BUFL 923
MTF Weekly UP CDSLWeekly Demand BUFL 1,249
MTF Daily UP CDSLDaily Demand DMIP BUFL 1,234
MTF Average UP 1135
ITF 240M UP CDSL240Mn Demand BUFL 1,245
ITF 180M UP CDSL180 Mn Demand BUFL 1,245
ITF 60M UP CDSL60 Mn Demand BUFL 1,245
ITF Average UP 1245
Trade Points 1124
Trade Plan ENTRY-1
Entry-1 1250
Entry-2 1034
SL 1040
RISK 210
REWARD 1884
Target as per Entry 3134
RR 9.0
Last High 1989
Last Low 1047

CDSL weekly timeframeYou're analyzing the **weekly chart** of **CDSL (Central Depository Services India Ltd)**, and here's a breakdown of the key elements from your chart:
---
### **Chart Overview & Interpretation:**
1. **Current Price**: ₹1,328.20
* Showing a **modest gain of 0.62%** on the week.
2. **Chart Type**: Weekly time frame (1W), good for **long-term trend analysis**.
3. **Support & Resistance:**
* **Strong support zone** near ₹1,150–₹1,155.
* **Resistance zone** around ₹1,900–₹2,000 (marked by top of green box).
* The **target zone** is around ₹2,473.20, suggesting a **long trade setup**.
4. **Trade Setup Observed (Likely Long Position):**
* **Entry Price**: Around ₹1,328.20
* **Stop-Loss**: ₹1,038.05 (red zone)
* **Target**: ₹2,473.20 (green zone)
* **Risk-Reward Ratio**: Roughly 1:3, which is favorable
5. **Trend**:
* After a sharp fall, stock **bounced back from the support level**.
* Shows a **potential trend reversal** or **continuation of the long-term uptrend**.
6. **Indicators (not shown directly but inferred):**
* Price bounced after a pullback → likely some **demand zone**.
* Forming **higher lows**, indicating **bullish structure**.
---
### **Conclusion (Trading View):**
* **Bullish Bias**: Based on the risk-reward setup and bounce from support.
* **Good R\:R Setup**: Entry at ₹1,328 with SL at ₹1,038 and target near ₹2,473.
* Suitable for **swing or positional trading** if broader market supports.
Would you like a clearer chart with technical indicators like RSI or moving averages added?

CDSL a Long term opportunity under dsicountI Am a Software Developer and a Passionate Trader
Over the past five years, I have explored nearly every aspect of trading—technical analysis, intraday trading, MTF, pre-IPO investments, options selling, F&O, hedging, swing trading, long-term investing, and even commodities like gold and crude oil.
Through this journey, I realized that technical analysis is only about 20% of the equation . The real game is psychology and mindset .
I have distilled my learnings into concise points below—insights that have shaped my approach and will continue to guide me in my version 2.0 of trading. I hope they prove valuable to you as well.
---
Position Sizing
One of the most important aspects of trading is choosing the right position size. Your trade should never be so large that it causes stress or worry. Keep it at a level where you can stay calm, no matter how the market moves.
Set Stop-Loss and Target Before Placing a Trade
Decide in advance when you will exit a trade—both at a loss ( stop-loss ) and at a profit ( target ). This helps maintain emotional balance, preventing extreme excitement or frustration.
How to Calculate Position Size
- Use technical analysis to identify your stop-loss and target .
- Example: If CMP is ₹100 and your stop-loss is at ₹94 (₹6 risk per share), determine your risk tolerance:
- ₹3,000 risk ➝ 500 shares (₹3,000 ÷ ₹6)
- ₹1,200 risk ➝ 200 shares (₹1,200 ÷ ₹6)
- Adjust quantity based on how much you're willing to risk.
Setting Target Price & Risk-Reward Ratio
The most important factor in setting a target is the risk-reward ratio . If your stop-loss is ₹6, your target should be at least ₹6, ₹9, or ₹12 .
Why Is Risk-Reward Important?
Let’s say you take 10 trades —5 go in your favor, and 5 go against you. If your risk-reward ratio isn’t favorable, you could end up in a loss.
Example:
- You lose ₹6 in two trades → ₹12 total loss
- You gain ₹3 in three trades → ₹9 total profit
- Net result: -₹3 loss
To ensure profitability, your reward should be equal to or greater than your risk . A 1.5x or 2x risk-reward ratio is ideal.
Flexibility in Targets
Even when the price reaches Target 1 , you can book partial profits and let the rest run with a trailing stop-loss .
---
Managing Multiple Trades
This is very important . If you're a beginner, limit yourself to 2 trades , and even if you're a pro, avoid more than 3-5 positions .
Example: If you have ₹2 lakh , make sure you have only 2 trades open at a time . Add a third stock only when you close another position .
---
How to Deploy Capital
Patience is key. If you have ₹1 lakh , divide it into 4-5 parts and buy in small chunks over time .
Why?
The nature of stocks is to move in waves—rising, facing profit booking, then breaking previous highs. Instead of investing everything at once, buy in staggered amounts to ensure your average price stays close to CMP .
---
Avoid Market Noise
When trading, stay in your zone .
Social media posts can make you feel slow compared to others , but they don't show the full picture. Avoid distractions like:
- Direct stock tips from news channels
- P&L snapshots from traders
- Following too many analysts on social media
Instead, listen to expert views , but stay disciplined with your own strategy .
---
Stock Selection
Stock selection has two elements—technical and fundamental (I'll write a separate post on this).
Always buy a stock that you can hold even in your darkest times .
Example:
- Choose blue-chip stocks with high market caps & strong promoter holdings
- Never buy a stock just because it’s in momentum
- If a stock turns into a forced SIP , it’s not a good buy
Pick stocks with a long-term story —even if you fail to exit at the right time, you should be comfortable holding them.
---
Accept That It’s the Market, Not You
Many traders fail because they don’t admit that the market is unpredictable .
Losses happen because of volatility, not necessarily poor strategy. Example:
- You lose a trade and try improving your method but face another hit
- Some losses are simply beyond your control
Most of what happens in the market is not in your hands —including stop-loss triggers. Accept this reality, and focus on risk management instead of revenge trading.
---
Keep Separate Trading & Investment Accounts
Trading and investing are different . If you keep them in the same account , you’ll:
- Book small profits on investments
- Hold short-term trades in losses
Having separate accounts keeps your goals clear .
---
Don’t Let the Market Dominate You
Even full-time traders shouldn’t obsess over the market .
Limit your screen time to 2-3 hours during market hours .
Why?
- You can’t act on global markets until 9:15 AM IST
- Even if a war or tariff issue arises, you can’t do anything until market open
- Overthinking leads to over-trading , which drains money
Instead, invest time in developing new skills .
---
Do What Suits You, Not Others
If you're good at swings, stick to swings . If you're good at intraday, do intraday .
Don't follow what works for a friend—trade based on what suits you .
---
Avoid FOMO
Don't stress if a stock jumps 20% in a day .
Stock accumulation zones, demand/supply areas, profit booking , and retests happen regularly —opportunities will always come.
Even traders who claim they made 20% in a day don’t share how often they got trapped chasing stocks .
---
Stop-Loss Is Your Best Friend
No, stop-loss is your best friend for life .
Example:
- Suppose you enter 10 trades in a month .
- 6 do well and you book profits.
- 4 go against you , but instead of exiting, you hold because you believe they’ll recover.
- Next month, you repeat this cycle —adding more positions.
Over time, this builds a portfolio of lagging stocks , and suddenly, your losses dominate your portfolio .
---
Even Experts Face Losses
Even professionals with advanced research teams lose money .
Retail traders often believe they can avoid losses by analyzing a few ratios , but losses are part of trading .
A stop-loss ensures you stay in the game long-term —instead of holding onto losing trades indefinitely.
---
Take a Break & Restart
Taking breaks is crucial . If everything is going wrong, don’t hesitate to press the reset button —step back, analyze, and refine your approach. A fresh mindset leads to better trading decisions. (I’ll write a detailed post on this soon.)

cdsl 1550 weekly cdsl 1550 weekly
Central Depository Services (India) Ltd. (CDSL) has shown strong financial performance recently, with a market capitalization of ₹256.53 billion and a price-to-earnings ratio of 46.15. The company has maintained steady growth in demat accounts, increasing its market share from 48% in FY 2018-19 to over 52% in FY 2020-21

CDSL Ready To Break Out! 1518/1629 ?From Moving Averages perspective CDSL is trading just above 20 &50 DMAs(177/1199) and below 100 & 200 DMAs (1447/1411).
From Fibonacci Retracements, it is just below 0.236 level and due for a bounce back to 0.5/0.618 levels (1518/1629).
Considering that the swing bottom is in place for the market as well as CDSL, one can expect a move towards 1400 followed by 1518 and 1629 in short to medium term (3 to 6 months) with Stop Loss at 1100.


CDSLCDSL,
watch above levels. waiting for re-test. Green line is entry level and redline is SL.
DISCLAIMER : I am NOT a SEBI registered advisor or a financial adviser. All the views are for educational purpose only.

CDSL Breakout ?If the stock sustains above 1200 this breakout can give a good move upside wait for volume confirmation i.e volume should be high. although its early to consider soon unless supported by proper volumes. the stock has corrected 40-45% from highs
