$CDSL should be range bound between 1739 and 1920?Good news is the sell off on 12/20 was with a low volume and did not fill the gap all the way to 1826 but the sell off stopped just at the prior gap 1739. So buyers may get inspired by that move and may come in tomorrow or later in the week if no follow up action from sellers. The bad news is - it pierced through quite a few potential support in a single session, meaning buyers are not strong on this stock. My guess is now the uptrend line - that indicates around 1920 level this week will be the upper bound for this stock after the heavy sell off on 12/20 and buyers may come back at around 1735 level.
CDSL trade ideas

CDSL LONGGood Volume Buildup.
ATH Breakout possible.
Good for Short term.
Target 2200 , 2400.
Disclaimer : This is not a Buy or Sell recommendation. I am not SEBI Registered. Please consult your financial advisor before making any investments . This is for Educational purpose only.

CDSL Keep a eye on CDSL NSE:CDSL
Keep a close watch
Disc: Invested for PWI Long term portfolio , looking to add more

CDSL buy ideaStock has consolidated for almost 3 months and again trying to start its new journey from here onwards. RSI on daily comes above 60 and also respected its Fibonacci level of 0.618. Can expect a target of 2150, 2417 and 2687.

CDSL for Swing/Positional CDSL Prediction for Swing/ Posional Trading
First breakout at Entry 1 level and this entry 1 retested. You can entry now . There is a resistance 1545-1670 level. You can enter in trade at Entry 2 level above 1360 or above Entry 3 above 2045 close weekly basis or you can entry at any of the above levels according to your experience.
SLs- 1100,1050 ( according to your entry and RRR)
Targets- 1360,1545,1670,1695,2045,2340,2535,2590,3030,… .
According to your “STOMACH” book your profit. Always maintain your risk management.
Watch Carefully – The Chart Explains For Itself.
Can anyone tell me which chat patterns are shown up here?
Disclaimer:
I am not a SEBI Registered Analyst. Anything posted here is my own analysis and views. This is created for educational purposes only. Always consult your Financial Advisor before taking any decision or trade.
Request: Please support by Like, follow, comment, share and boost.
Happy trading.
About CDSL –
Central Depository Services (India) Ltd. engages in the provision of depository services. It operates through the following segments: Depository Services, Data Processing Services, and Others. The company was founded in February 1999 and is headquartered in Mumbai, India.
You can follow me in social media through links given below-

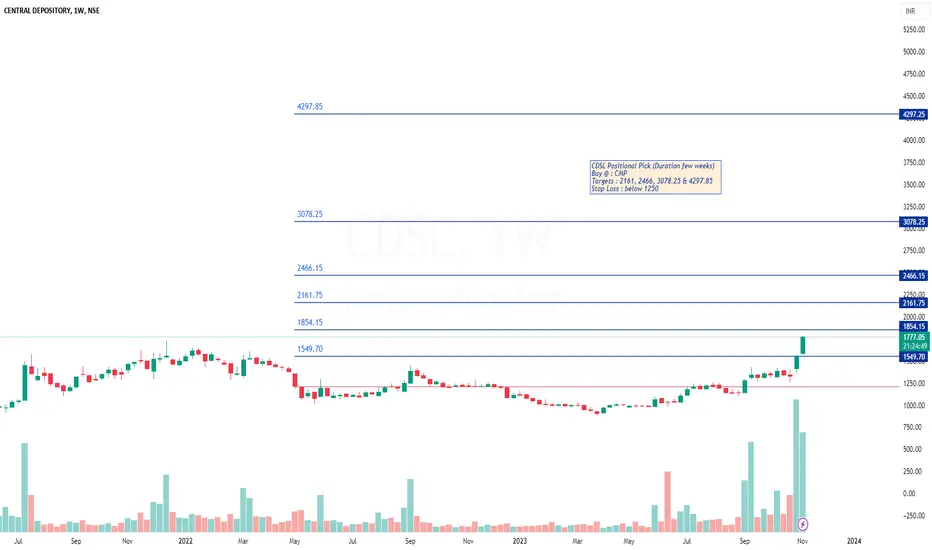
CDSL Positional Pick$NSE:CDSLPositional Pick (Duration few weeks)
Buy @ : CMP
Targets : 2161, 2466, 3078.25 & 4297.85
Stop Loss : below 1250
Swing Buy Opportunity in CDSLRefer the chart for Entry,Target and SL.
NOTE: This trade is only for Equity Swing buy and not to be considered for options trading.
Please do follow Position Sizing and Risk Reward Ratio while planning any trades.
Note: This information is for education purpose only and please do your own research and consult your financial advisor prior to taking any action.
TO CONNECT WITH ME CHECK OUT MY BIO.
If you like this Idea, Please do like my ideas and share it with your friends. check my bio.
Please boost my ideas and send cheers as it acts as a motivation to keep posting my analysis.
Thank you

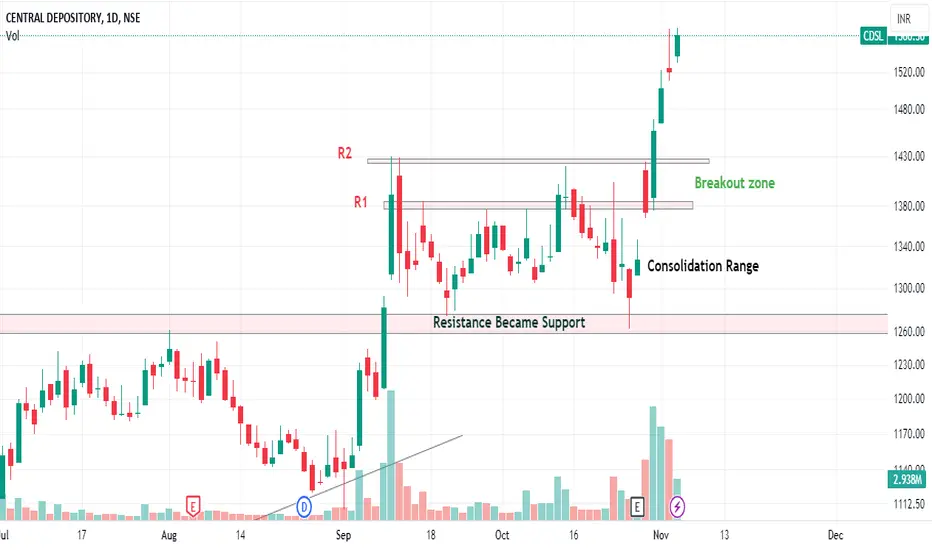
CDSL has given a breakout on daily time frame after a good consCDSL has given a breakout on daily time frame after a good consolidation.
Company has delivered good profit growth of 21.6% CAGR over last 5 years.
Company has a good return on equity (ROE) track record: 3 Years ROE 26.7%.
Debt to Equity Ratio 0.00

CDSLCDSL : 1100
After long consolidation, stock is getting ready for fresh upside
TGT : 1300
SL : 1030
Period: 3-6 Months


CDSLlook to go long in #CDSL until 1590 levels are held, As we can see the stock has broken free with high volumes!
Stocks looks in a very strong upwards trend.
S1- 1725
S2- 1590.

CDSLCDSL (1D)
CMP 1910.75
- Given Breakout in Previous Sessions
- Retesting Previous High Levels
- Moving above all KMA
- Bouncing from support Zone
- ATH Breakout
- Demat account crossed 10 Crore mark Biggest Beneficiary of Demat Opening
Already Covered at 1117.25
Sector : Finance
Industry : Finance - Others
Market Cap : 19,967.34 Cr.
Category : Small Cap
PE : 62.36
Industry PE : 45.75
About Central Depository Services (India) Ltd.
CDSL operates as a securities depository in India. It offers various services, such as account opening, dematerialization, processing delivery and receipt instructions, account statement, re-materialization, pledging, nomination, transmission of securities, change in address, bank account details and SMS services for depository participants.
The company was incorporated at Mumbai on December 12, 1997 as Central Depository Services (India) (CDSL), a public limited company under the Companies Act, 1956. The company obtained its certificate of commencement of business from the Ministry of Corporate Affairs on December 19, 1997. The company was initially registered by way of a certificate of registration on August 19, 1998 by SEW under the Depositories Regulations and subsequently obtained its certificate of commencement of business as a depository under the Depositories Regulations on February 8, 1999.
The company is the leading securities depository in India by incremental growth of Beneficial Owner (BO) accounts over the last three fiscals and by the total number of registered Depository Participants (DPS). However, in terms of market share, it is the second largest depository in India. Its revenue from operations includes transaction charges, account maintenance charges and settlement charges paid by DPs and annual fees, corporate action charges and e-voting charges paid by companies whose securities are admitted to its systems
The company commenced its depository business in 1999 with the objective of providing convenient, dependable and secure depository services at affordable cost to all market participants. It was initially promoted by the BSE which subsequently divested a part of its stake to leading Indian banks. It has connectivity with clearing corporations of all the leading Indian stock exchanges including the BSE, National Stock Exchange (NSE) and Metropolitan Stock Exchange of India.
Business area of the company
CDSL operates as a securities depository in India. It offers various services, such as account opening. dematerialization, processing delivery and receipt instructions, account statement, re-materialization, pledging, nomination, transmission of securities, change in address, bank account details and SMS services for depository participants.

CDSL ready for another run?After a good impulse movement on the upside, CDSL price corrected for a few trading sessions. It has now given a breakout above the resistance level with the support of increasing volume. DMI also shows potential strength in the upside momentum. From here we can see another good run in CDSL in the short-term
Buy Entry - 1910
Stop Loss - 1770
Target - 2550/1680

CDSL: Bullish BreakoutCDSL has given a triangle pattern breakout and have confirmed it with a retracement and an upmove!
You can keep this stock in your watchlist!

Clear breakout weekly monthly and now Retest.Very clear breakout on monthly and weekly chart with the strong relative strength. Revenue of the stock and earning per share also continuous quarterly by quarterly growing up, R S I on both chart above then 60, momentum also showing a strong, good smart volume also showing this share will Ready to take off.

CDSLNSE:CDSL
One Can Enter Now !
Or Wait for Retest of the Trendline (BO) !
Or wait For better R:R ratio !
Note :
1.One Can Go long with a Strict SL below the Trendline or Swing Low.
2. R:R ratio should be 1 :2 minimum
3. Plan as per your RISK appetite and Money Management.
Disclaimer : You are responsible for your Profits and loss, Shared for Educational purpose

CDSl – at ATH - More UpsideCDSl – at ATH
The stock has now crossed the previous High made almost two years back and at all-time high. But We did catch the current up move very early at 1117 levels in late June. Refer my post of 29th June.
All parameters like Relative strength, Absolute strength, Buying Pressure, Continuous Volume support all indicate further upside. Even high delivery volume indicates good amount of long-term buying.

CDSL Weekly chart breakoutCompany Overview:
Central Depository Services Limited (CDSL) is one of the two central securities depositories in India, facilitating the holding and transfer of securities in electronic form. As a key player in the financial infrastructure sector, CDSL plays a crucial role in supporting the efficiency and transparency of the Indian capital market.
Market Position:
CDSL holds a significant position in India's securities depository landscape, providing depository services to a diverse range of market participants, including investors, issuers, and intermediaries. The company's robust technology infrastructure and commitment to service quality contribute to its leadership in the depository services industry.
Key Investment Themes:
Dematerialization Trend: With the ongoing trend toward dematerialization of securities, CDSL is poised to benefit from the increasing preference for electronic holding and trading of financial instruments. The shift from physical to electronic securities aligns with global market trends.
Growing Capital Markets: As India's capital markets continue to expand, driven by economic growth and increased investor participation, the demand for depository services is expected to rise. CDSL, being a key infrastructure provider, stands to gain from the growth in the securities market.
Technology and Innovation: CDSL's focus on technology and innovation, including the implementation of blockchain technology, enhances the efficiency and security of its depository services. Continued technological advancements contribute to the company's competitiveness and adaptability.
Diverse Product Offerings: CDSL offers a range of depository and related services, including dematerialization, pledge creation, and electronic voting. The diversity of its product offerings allows the company to cater to the evolving needs of market participants and broaden its revenue streams.
Regulatory Support: As a regulated entity, CDSL operates under the oversight of regulatory bodies like SEBI. The supportive regulatory environment ensures adherence to best practices, fosters investor confidence, and contributes to the stability of the depository services industry.
Risks and Mitigation:
Market Competition: The depository services sector is characterized by competition. CDSL mitigates this risk through continuous improvement in service quality, innovation, and maintaining strong relationships with market participants.
Technological Risks: Dependence on technology exposes CDSL to risks such as system failures and cybersecurity threats. The company addresses these risks through robust technology infrastructure, regular audits, and investments in cybersecurity measures.
Regulatory Changes: Changes in regulations or the introduction of new market practices can impact the depository services industry. CDSL actively engages with regulatory authorities to stay abreast of changes and ensure compliance.
Long-Term Outlook:
Central Depository Services Limited presents a compelling investment opportunity as a key player in India's evolving capital market infrastructure. With the ongoing digitization of securities and the growth of the financial markets, CDSL is well-positioned to play a vital role in shaping the future of the Indian securities depository landscape.
Investors seeking exposure to the financial infrastructure sector in India may consider including CDSL in their portfolio. However, it's crucial to stay informed about regulatory developments, technological advancements, and market dynamics while maintaining a long-term investment horizon. Conducting thorough research and periodic reassessment of the investment thesis is advisable to adapt to changing market conditions.

CDSL - Stock AnalysisThe technical highlights for Central Depository Services (India) Ltd. (CDSL) suggest a generally bullish sentiment with some caution. Here's a summary of the key signals:
Price Volume: Mild Bullish - The recent sessions show rising prices, but the caution is warranted as the volume is not supporting the price increase.
High-Low: Bullish - The stock has made a new one-year high, indicating positive price momentum.
One Day: Bullish - The latest tick shows a strong price rise, but caution is advised to monitor the volume.
MACD: Bullish - A bullish crossover of the MACD (Moving Average Convergence Divergence) and the signal line has occurred and is sustaining, indicating positive momentum.
Donchian Band: Strong Bullish - The stock is trending up nicely, with consecutive new highs, indicating a strong bullish trend.
Bollinger Bands: Strong Bullish - There's a positive breakout in the Bollinger Bands, suggesting potential upward movement in the stock's price.
ADX: Bullish - The Average Directional Index (ADX) indicates an uptrend in the stock.
Candlestick / Heikin Ashi Patterns:
- Daily: Bullish - A bullish continuation Heikin Ashi pattern has formed, supporting the bullish sentiment.
- Weekly: Bullish - A bullish continuation Heikin Ashi pattern on the weekly chart reinforces the bullish outlook.
- Monthly: Strong Bullish - A bullish Marubozu candlestick pattern has formed at a high level on the monthly chart, indicating strong momentum. Additionally, a bullish continuation Heikin Ashi pattern supports the bullish trend.
Overall, the technical analysis suggests a bullish outlook for CDSL, with strong price momentum, new highs, and positive indicators. However, the cautionary notes about volume should be considered. As always, it's essential to conduct a thorough analysis and consider other factors before making investment decisions.

CDSL ........ bullish view ......CDSL 1567 4/11/2023 ......looking very bullish and given breakout on weekly charts ...... you can see inverse head and shoulder ( not a book picture) ...... at its breakout it was in consolidation for multiweek ..... if you closely observe monthly chart than you can see it is in breakout range ..... first it would touch around 1700/ 1750 it's previous highs and than 2250 and 3050 eventually in longer run according to my fibonacci analysis

CDSL has given a strong breakout on daily chartCDSL has give a strong breakout on daily chart if stock breaks it's life high we will see this stock above 2250

Buy long CDSL at 1456 for target of 1987 SL-1421,Exp.return-36%Cup and handle formation break out with huge volume
