Ceat this just for study purpose ,not buy and sell recomondationAs per my analysis Ceatltd can reach 38.2%-50% range. to complete 4th wave , this is just for study purpose and not a buy or sell recommendation.
CEATLTD trade ideas

CEATLTDNSE:CEATLTD
LIFE TIME BO!!!
One Can Enter Now ! Or Wait for Retest of the Trendline (BO) Or wait For better R:R ratio
Note :
1.One Can Go long with a Strict SL below the Trendline or Swing Low of Daily Candle.
2. Close, should be good and Clean.
3. R:R ratio should be 1 :2 minimum
4. Plan as per your RISK appetite
Disclaimer : You are responsible for your Profits and loss, Shared for Educational purpose

SWING IDEA - CEAT LTDCEAT Ltd , a major player in the tire industry, is currently showing technical signals that suggest a potential swing trade opportunity.
Reasons are listed below:
Break of Symmetrical Triangle Pattern : The stock has broken out of a symmetrical triangle pattern, indicating a potential shift in momentum and the beginning of a new bullish trend.
Bullish Engulfing Pattern on Daily Timeframe : A bullish engulfing pattern has formed on the daily chart, signaling strong buying pressure and a possible continuation of the upward movement.
Support of 50 EMA on Daily Timeframe : The stock is finding support at the 50-day exponential moving average, reinforcing the overall bullish sentiment and providing a strong support level for the current trend.
Spike in Volumes : A noticeable increase in trading volumes confirms the strength of the breakout, indicating strong investor interest and participation in the move.
Constant Higher Highs : The stock has been consistently making higher highs, a classic sign of a strong uptrend, suggesting continued momentum in the upward direction.
Target - 3000 // 3170
Stoploss - Daily close below 2575
DISCLAIMER -
Decisions to buy, sell, hold or trade in securities, commodities and other investments involve risk and are best made based on the advice of qualified financial professionals. Any trading in securities or other investments involves a risk of substantial losses. The practice of "Day Trading" involves particularly high risks and can cause you to lose substantial sums of money. Before undertaking any trading program, you should consult a qualified financial professional. Please consider carefully whether such trading is suitable for you in light of your financial condition and ability to bear financial risks. Under no circumstances shall we be liable for any loss or damage you or anyone else incurs as a result of any trading or investment activity that you or anyone else engages in based on any information or material you receive through TradingView or our services.
@visionary.growth.insights

CEAT LTDNSE:CEATLTD
One Can enter now!
Or Wait for a retest of the trendline(BO)!
Or Wait for a better Risk:Reward Ratio!
Note :
1. One should go long with a StopLoss, below the Trendline or the Previous Swing Low.
2. Risk :Reward ratio should be minimum 1:2.
3. Plan your trade as per the Money Mangement and Risk Appetite.
Disclamier : You are responsible for your profits and loss.
The idea shared here is purely for Educational purpose.
Follow back, for more ideas and thier notifications on your email.
Support and Like incase the idea works for you.

Trying for horizontal line break outPrice didn't fall much after dividend payout. Trying to go up.
Trade carefully.

Ready for DARVAS BOX Breakout...NSE:CEATLTD trade at 2845. Support @ 2500 Resistence @ 3000
on the weekly chart made a DARVAS BOX Pattern, after its breakout you can watch for next resistence @ 4000

Focus on ceat tyer make a ascending triangle pattern on weekly.Ceat tyer is make ascending triangle pattern this stock is buy zone.This stock is next rajistance 3000. add this stock on his watchlist.

CEAT LTD S/RSupport and Resistance Levels:
Support Levels: These are price points (green line/share) where a downward trend may be halted due to a concentration of buying interest. Imagine them as a safety net where buyers step in, preventing further decline.
Resistance Levels: Conversely, resistance levels (red line/shade) are where upward trends might stall due to increased selling interest. They act like a ceiling where sellers come in to push prices down.
Breakouts:
Bullish Breakout: When the price moves above resistance, it often indicates strong buying interest and the potential for a continued uptrend. Traders may view this as a signal to buy or hold.
Bearish Breakout: When the price falls below support, it can signal strong selling interest and the potential for a continued downtrend. Traders might see this as a cue to sell or avoid buying.
20 EMA (Exponential Moving Average):
Above 20 EMA: If the stock price is above the 20 EMA, it suggests a potential uptrend or bullish momentum.
Below 20 EMA: If the stock price is below the 20 EMA, it indicates a potential downtrend or bearish momentum.
Trendline: A trendline is a straight line drawn on a chart to represent the general direction of a data point set.
Uptrend Line: Drawn by connecting the lows in an upward trend. Indicates that the price is moving higher over time. Acts as a support level, where prices tend to bounce upward.
Downtrend Line: Drawn by connecting the highs in a downward trend. Indicates that the price is moving lower over time. It acts as a resistance level, where prices tend to drop.
RSI: RSI readings greater than the 70 level are overbought territory, and RSI readings lower than the 30 level are considered oversold territory.
Combining RSI with Support and Resistance:
Support Level: This is a price level where a stock tends to find buying interest, preventing it from falling further. If RSI is showing an oversold condition (below 30) and the price is near or at a strong support level, it could be a good buy signal.
Resistance Level: This is a price level where a stock tends to find selling interest, preventing it from rising further. If RSI is showing an overbought condition (above 70) and the price is near or at a strong resistance level, it could be a signal to sell or short the asset.
Disclaimer:
I am not a SEBI registered. The information provided here is for learning purposes only and should not be interpreted as financial advice. Consider the broader market context and consult with a qualified financial advisor before making investment decisions.


TARGET EXPLAINING OF RECTANGLE PATTERN IN CEATAs i told you in CEAT trade that there is rectangle pattern breakout.
All you can see that our target has been done in only 4-5 days.

RECTANGLE BREAKOUT PATTERNToday we will learn some a simple breakout strategies like Rectangle pattern breakout.
As you see in chart price is stuck in range and give a breakout .
So we can look for long in this stock, my viewpoint is going straight towards our target.
Don't look as a investment take as a swing trade it will be better for long holding price should be in a bottom and there is no bottom in this stock.
Take it as a learning trades and get a better traders in life.

CEATLTD great risk to rewardNifty making all time high. India Vix at comfortable level. Nifty Auto sector outperforming Nifty. Tyres industry showing strength. CMP 2172, SL 2060, TGT 2515-2520. R:R 1:3. Fundamentals are also looking good.

CEAT LTD in Break Out - cmp 2513Ceat ltd has taken support in daily chart and reversed.
Breakout happened and holding above the resistance levels. High possibilities to move up from here.
we can buy with the target of 2610
3.80% Upside Potential

CEAT on a bullish momentumThe stock of CEAT Tyres (NSE: CEATLTD) is exhibiting bullish momentum and has crossed 2018 high of 2000 with a bang!
The price action seems bullish and the path of least resistance is up toward the 1.618 Fibonacci extension target of 2900.

Ceat Ltd.Ceat Ltd.
C&H Formation on Yearly Basis.
Strong Price Trendline BreakOut
Vol. BuiltUp Continued
Trail SL with Upside.
Book Profit as per Risk Appetite.
Do Your Own Research as well.
Happy Investing 😇

#CEATLTD for a potential breakout !👉🏻Stock Trading above 20 & 50 EMA
👉🏻Price consolidating in a small base.
👉🏻Breakout above 2110 Support 2025
👉🏻RR Favorable for going long
Don't forget to hit that❤️for a like🔁for a share,and🔖for a bookmark!
#bullish #stockmarket #stockstowatch #Stocks #Investing

Buy Ceat ltd at 2000-2100 . Target 4000ceat breaking after a long 5 year consolidation.
buy at 2000-2100.
target 4000-8000.
long term target 18000.
yes 18k possible on upside with patience .

ceatrecorded a rise in its attributable consolidated net profit to 1.34 billion Indian rupees in the quarter ended March 31 as against 252.5 million rupees a year ago.
Earnings per share stood at 33.05 rupees compared with 6.24 rupees, according to a Thursday filing.
Revenue from operations in fiscal Q4 also increased to 28.75 billion rupees from 25.92 billion rupees in the corresponding quarter of the previous fiscal year.
The board of the company recommended a final dividend 12 rupees per equity share of face value of 10 rupees for
the financial year ended March 31.

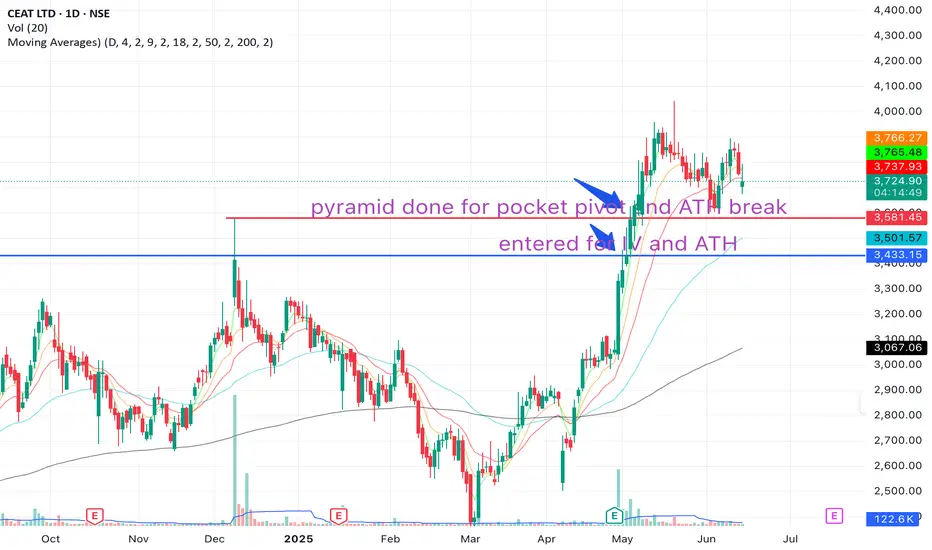
CEATLTDA Very Good Chart in formation on weekly and monthly time frame as well as VCP is also forming. If it gives breakout in weekly timefame can think of building positions and can pryamid if monthly candle above sustain the horizontal line. Views should be a bit long as the pattern is in weekly as well as monthly

CEATNSE:CEATLTD
Note :
1.One Can Go long with a Strict SL below the Trendline or Swing Low of Daily Candle.
2. Close, should be good and Clean.
3. R:R ratio should be 1 :2 minimum
4. Plan as per your RISK appetite
Disclaimer : You are responsible for your Profits and loss, Shared for Educational purpose!

ideal sell setupsCeat tyre was in uptrend
however stock on weekly chart was making multiple wicks at higherareas.
the stock was trading near earlier resistance.
The RSI indicator suggested heavily overbought with above 2 things into place.
also along with this there was a lower high formation too! indicating supply !

