Next report date
—
Report period
—
EPS estimate
—
Revenue estimate
—
26.35 INR
664.70 M INR
19.99 B INR
13.77 M
About CENTURY ENKA LTD
Sector
Industry
CEO
Suresh Sodani
Website
Headquarters
Pune
Founded
1965
ISIN
INE485A01015
FIGI
BBG000CPTWP1
Century Enka Ltd. engages in the manufacture and sale of synthetic yarn related products. It specializes in nylon tire cord fabric and nylon filament yarn used in apparel industry. The company was founded on November 17, 1965 and is headquartered in Pune, India.
Related stocks
CENTURY ENKA LTD S/RSupport and Resistance Levels:
Support Levels: These are price points (green line/shade) where a downward trend may be halted due to a concentration of buying interest. Imagine them as a safety net where buyers step in, preventing further decline.
Resistance Levels: Conversely, resistance levels (re

50 SMA Rising - Swing TradeDisclaimer: I am not a Sebi registered adviser.
This Idea is publish purely for educational purpose only before investing in any stocks please take advise from your financial adviser.
50 SMA Rising strategy. Suitable for Swing Trading Initial Stop loss lowest of last 2 candles and keep trailing wit

CENTENKA - Bullish SetupStock name - Century Enka Limited.
Weekly chart setup
Chart is self explanatory everything.
Master score - B
Disclaimer : This is for demonstration and educational purpose only. This is not buying or selling recommendations. I'm not SEBI registered.

Positional trade setup for Century Enka LtdStock: Century Enka Ltd
Current Price: 776
Stop Loss: 634
This suggests a bullish outlook.
Potential Positional Trade Idea
Long Position:
Rationale: The wide stop-loss indicates a strong conviction in the upward movement of the stock. Given the current price of 776 and a stop-loss of 634, there's

Cup and handle pattern breakoutGood volume buildup in daily as well as in weekly timeframe.
Cup and handle pattern breakout with good volume.
Smallcap⚠️⚠️
QOQ sales are up.
Fundamental's are OK.
FII & DII stakes are up significantly.
NOTE: I do my analysis, do your before trade.

CENTENKA1. Anything can happen.
2. You don't need to know what is going to happen next in order to make money.
3. There is a random distribution between wins and losses for any given set of variables that define an edge. No other thoughts
4. An edge is nothing more than an indication of a higher probability

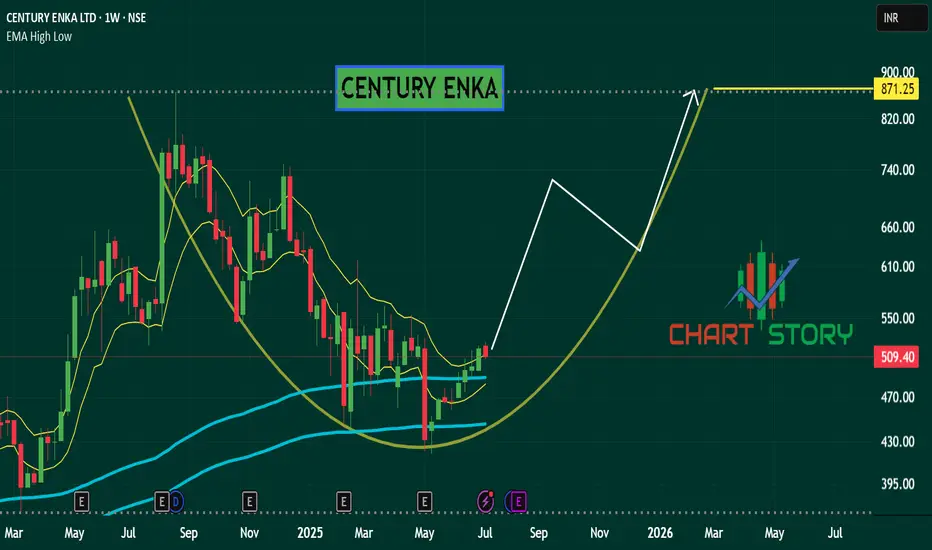
Century Enka LongTwo Years Breakout
Swing Trading Setup
Very Big Weekly Closing with Very High Volume


simple 2 Year Consolidation 1D TF Morning starsimple U cup shape pattern, in 2 year consolidation.
in Higher TF 18 year consolidation and current day is retracement zone. in 1 D TF morning star pattern

See all ideas
Summarizing what the indicators are suggesting.
Oscillators
Neutral
SellBuy
Strong sellStrong buy
Strong sellSellNeutralBuyStrong buy
Oscillators
Neutral
SellBuy
Strong sellStrong buy
Strong sellSellNeutralBuyStrong buy
Summary
Neutral
SellBuy
Strong sellStrong buy
Strong sellSellNeutralBuyStrong buy
Summary
Neutral
SellBuy
Strong sellStrong buy
Strong sellSellNeutralBuyStrong buy
Summary
Neutral
SellBuy
Strong sellStrong buy
Strong sellSellNeutralBuyStrong buy
Moving Averages
Neutral
SellBuy
Strong sellStrong buy
Strong sellSellNeutralBuyStrong buy
Moving Averages
Neutral
SellBuy
Strong sellStrong buy
Strong sellSellNeutralBuyStrong buy
Displays a symbol's price movements over previous years to identify recurring trends.
Frequently Asked Questions
The current price of CENTENKA is 498.00 INR — it has decreased by −5.18% in the past 24 hours. Watch CENTURY ENKA LTD stock price performance more closely on the chart.
Depending on the exchange, the stock ticker may vary. For instance, on NSE exchange CENTURY ENKA LTD stocks are traded under the ticker CENTENKA.
CENTENKA stock has fallen by −6.95% compared to the previous week, the month change is a −3.73% fall, over the last year CENTURY ENKA LTD has showed a −12.46% decrease.
CENTENKA reached its all-time high on Aug 21, 2024 with the price of 864.90 INR, and its all-time low was 26.00 INR and was reached on Feb 24, 1999. View more price dynamics on CENTENKA chart.
See other stocks reaching their highest and lowest prices.
See other stocks reaching their highest and lowest prices.
CENTENKA stock is 2.74% volatile and has beta coefficient of 1.41. Track CENTURY ENKA LTD stock price on the chart and check out the list of the most volatile stocks — is CENTURY ENKA LTD there?
Today CENTURY ENKA LTD has the market capitalization of 10.75 B, it has increased by 1.05% over the last week.
Yes, you can track CENTURY ENKA LTD financials in yearly and quarterly reports right on TradingView.
CENTURY ENKA LTD is going to release the next earnings report on Nov 14, 2025. Keep track of upcoming events with our Earnings Calendar.
CENTENKA net income for the last quarter is 153.80 M INR, while the quarter before that showed 67.60 M INR of net income which accounts for 127.51% change. Track more CENTURY ENKA LTD financial stats to get the full picture.
Yes, CENTENKA dividends are paid annually. The last dividend per share was 10.00 INR. As of today, Dividend Yield (TTM)% is 2.03%. Tracking CENTURY ENKA LTD dividends might help you take more informed decisions.
CENTURY ENKA LTD dividend yield was 1.84% in 2024, and payout ratio reached 32.87%. The year before the numbers were 2.49% and 51.11% correspondingly. See high-dividend stocks and find more opportunities for your portfolio.
As of Aug 4, 2025, the company has 3.1 K employees. See our rating of the largest employees — is CENTURY ENKA LTD on this list?
EBITDA measures a company's operating performance, its growth signifies an improvement in the efficiency of a company. CENTURY ENKA LTD EBITDA is 936.50 M INR, and current EBITDA margin is 5.74%. See more stats in CENTURY ENKA LTD financial statements.
Like other stocks, CENTENKA shares are traded on stock exchanges, e.g. Nasdaq, Nyse, Euronext, and the easiest way to buy them is through an online stock broker. To do this, you need to open an account and follow a broker's procedures, then start trading. You can trade CENTURY ENKA LTD stock right from TradingView charts — choose your broker and connect to your account.
Investing in stocks requires a comprehensive research: you should carefully study all the available data, e.g. company's financials, related news, and its technical analysis. So CENTURY ENKA LTD technincal analysis shows the strong sell today, and its 1 week rating is sell. Since market conditions are prone to changes, it's worth looking a bit further into the future — according to the 1 month rating CENTURY ENKA LTD stock shows the neutral signal. See more of CENTURY ENKA LTD technicals for a more comprehensive analysis.
If you're still not sure, try looking for inspiration in our curated watchlists.
If you're still not sure, try looking for inspiration in our curated watchlists.