Central BankSEBI-Disclosure for Stock Analysis
For Informational Purposes Only: The analysis provided above is for educational and informational purposes only and is based on the technical interpretation of the supplied stock chart. It should not be construed as financial advice, investment advice, or a recomm
Next report date
—
Report period
—
EPS estimate
—
Revenue estimate
—
4.86 INR
39.34 B INR
395.47 B INR
626.18 M
About CENTRAL BANK OF INDIA
Sector
Industry
CEO
Matam Venkat Rao
Website
Headquarters
Mumbai
Founded
1911
ISIN
INE483A01010
FIGI
BBG000FTQRR2
Central Bank of India engages in the provision of commercial banking products and services. It operates through the following segments: Treasury, Corporate and Wholesale Banking, Retail Banking, and Other Banking Operations. The Treasury segment includes dealing in government and other securities, money market operations, and forex operations. The Corporate and Wholesale Banking segment is composed of advances to trusts and partnership firms, companies, and statutory bodies. The Retail Banking segment consists of exposures subject to orientation, product, granularity criteria, and individual exposures. The company was founded by Sorabji Pochkhanawala on December 21, 1911 and is headquartered in Mumbai, India.
Related stocks
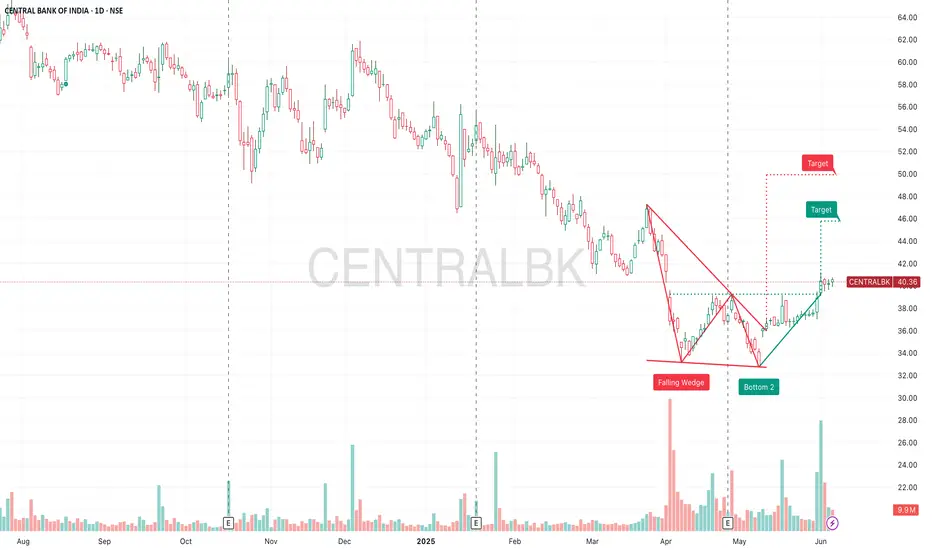
Analyzing Central Bank of India's Bullish Breakout PatternAnalyzing Central Bank of India's Bullish Breakout Pattern: Key Insights, Target Projections, and Entry Point Strategy
The Central Bank of India stock chart, presented above, reveals a rich tapestry of technical indicators and patterns that suggest a strong potential for a bullish breakout. With a

CentralBank-Swing Bullish- Will this support is strong enough?! NSE:CENTRALBK
19.08.2024
Buy 60
Target 66
Stop Loss 56
Risk Reward- 1:1.5
1. Inside bar breakout
2. 200 EMA perfect rejection
3. Price bounced from strong key level(Resistance turned to support)
4. After good uptrend price under consolidation from last 5 months
5. RSI bounced from over sold

CENTRALBK - Central Bank of India - Strong Bullish MomentumTechnical Analysis of CENTRALBK
As per chart pattern, this stock is in bullish trend in Weekly and Monthly time frames . But consolidating in one hour (H1), Four Hour (H4) and Daily (D1) time frame in symmetrical triangle with few local Support/Resistance and major support/Resistance as menti

CENTRALBKLooks good on Charts.
Volume Buildup seen in all PSU Banks.
Above all Key EMA.
Short term target 77 , 92.
Do Like ,Comment , Follow for regular Updates...
Keep Learning ,Keep Earning...
Disclaimer : This is not a Buy or Sell recommendation. I am not SEBI Registered. Please consult your financial

central bank of india-1dfibo is best tool for long term pick up and exit stratergy.
central bank of india break out 30 level target trail every weekly basis.
education purpose only.

Central Bank of India with good ROI A rounding bottom pattern gave a good breakout with massive volume, the stock is again retesting the breakout level, and once the volumes kick in again, it will be a buy signal.
Buy - 41-44
Tgt - i) 10% (swing)
ii) 40% (short-term)
Stoploss - 3%
-- DISCLAIMER --
I am

Central bank of india Buy this gem for long term and short term profit
Log term target will be double

CENTRALBK - Central Bank of IndiaAs per previous chart history and current position of this stock, it is indicating to buy at CMP or wait for a dip to enter on reversal. Fundamentals are strong of this stock.
Buy at low with target at 49.90, 50.65, 51.90, 53.45, 55, 57.95
All major points are mentioned on the chart itself
Do yo

Central Bank Of India Breakout Level 51.2Central Bank Of India make a breakout and also retest is also done
Above 51.2 central bank of india will go for a test of new levels i.e approx 100-110
Increase in volume seen

See all ideas
Summarizing what the indicators are suggesting.
Neutral
SellBuy
Strong sellStrong buy
Strong sellSellNeutralBuyStrong buy
Neutral
SellBuy
Strong sellStrong buy
Strong sellSellNeutralBuyStrong buy
Neutral
SellBuy
Strong sellStrong buy
Strong sellSellNeutralBuyStrong buy
An aggregate view of professional's ratings.
Neutral
SellBuy
Strong sellStrong buy
Strong sellSellNeutralBuyStrong buy
Neutral
SellBuy
Strong sellStrong buy
Strong sellSellNeutralBuyStrong buy
Neutral
SellBuy
Strong sellStrong buy
Strong sellSellNeutralBuyStrong buy
Displays a symbol's price movements over previous years to identify recurring trends.
Frequently Asked Questions
The current price of CENTRALBK is 35.93 INR — it has decreased by −0.76% in the past 24 hours. Watch CENTRAL BANK OF INDIA stock price performance more closely on the chart.
Depending on the exchange, the stock ticker may vary. For instance, on NSE exchange CENTRAL BANK OF INDIA stocks are traded under the ticker CENTRALBK.
CENTRALBK stock has fallen by −3.91% compared to the previous week, the month change is a −8.61% fall, over the last year CENTRAL BANK OF INDIA has showed a −43.77% decrease.
We've gathered analysts' opinions on CENTRAL BANK OF INDIA future price: according to them, CENTRALBK price has a max estimate of 56.00 INR and a min estimate of 56.00 INR. Watch CENTRALBK chart and read a more detailed CENTRAL BANK OF INDIA stock forecast: see what analysts think of CENTRAL BANK OF INDIA and suggest that you do with its stocks.
CENTRALBK reached its all-time high on Nov 8, 2010 with the price of 212.16 INR, and its all-time low was 10.10 INR and was reached on Mar 23, 2020. View more price dynamics on CENTRALBK chart.
See other stocks reaching their highest and lowest prices.
See other stocks reaching their highest and lowest prices.
CENTRALBK stock is 1.84% volatile and has beta coefficient of 1.81. Track CENTRAL BANK OF INDIA stock price on the chart and check out the list of the most volatile stocks — is CENTRAL BANK OF INDIA there?
Today CENTRAL BANK OF INDIA has the market capitalization of 329.74 B, it has decreased by −1.38% over the last week.
Yes, you can track CENTRAL BANK OF INDIA financials in yearly and quarterly reports right on TradingView.
CENTRAL BANK OF INDIA is going to release the next earnings report on Oct 16, 2025. Keep track of upcoming events with our Earnings Calendar.
CENTRALBK net income for the last quarter is 12.82 B INR, while the quarter before that showed 11.05 B INR of net income which accounts for 16.06% change. Track more CENTRAL BANK OF INDIA financial stats to get the full picture.
CENTRAL BANK OF INDIA dividend yield was 0.44% in 2024, and payout ratio reached 4.14%. The year before the numbers were 0.00% and 0.00% correspondingly. See high-dividend stocks and find more opportunities for your portfolio.
As of Aug 1, 2025, the company has 33.08 K employees. See our rating of the largest employees — is CENTRAL BANK OF INDIA on this list?
Like other stocks, CENTRALBK shares are traded on stock exchanges, e.g. Nasdaq, Nyse, Euronext, and the easiest way to buy them is through an online stock broker. To do this, you need to open an account and follow a broker's procedures, then start trading. You can trade CENTRAL BANK OF INDIA stock right from TradingView charts — choose your broker and connect to your account.
Investing in stocks requires a comprehensive research: you should carefully study all the available data, e.g. company's financials, related news, and its technical analysis. So CENTRAL BANK OF INDIA technincal analysis shows the strong sell today, and its 1 week rating is strong sell. Since market conditions are prone to changes, it's worth looking a bit further into the future — according to the 1 month rating CENTRAL BANK OF INDIA stock shows the sell signal. See more of CENTRAL BANK OF INDIA technicals for a more comprehensive analysis.
If you're still not sure, try looking for inspiration in our curated watchlists.
If you're still not sure, try looking for inspiration in our curated watchlists.