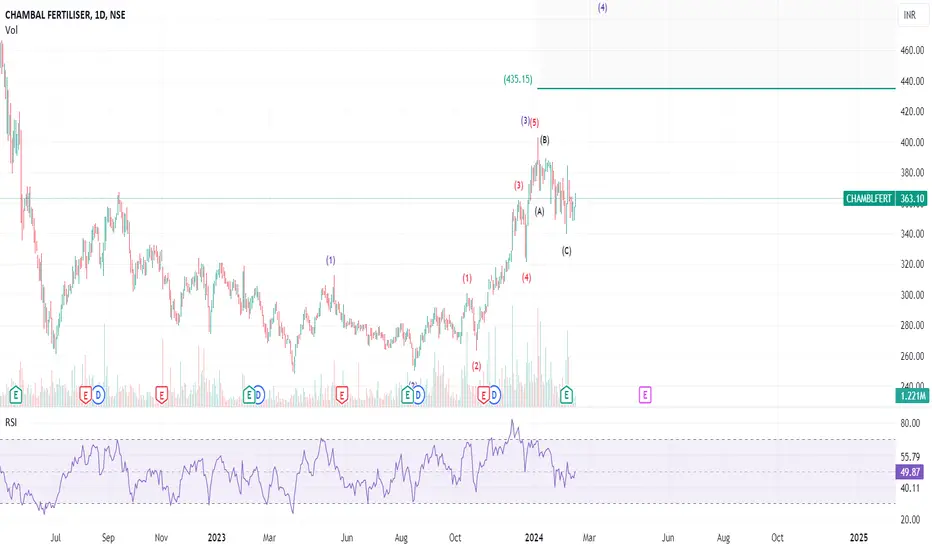
Riding the 5th Wave: Chamblfert's 20% UpsideThe fourth wave has concluded with an ABC correction, suggesting a potential move towards the fifth wave. Anticipating Chamblfert's commitment to pursuing this next wave, there is potential for a substantial 20% return.
CHAMBLFERT trade ideas
Chambal Fertilizer It gave good consolidation and now trading above previous lower high.
Stock is near 0.5 Fib level. It'll probably see a good upmove after a break of
current swing high.

Downtrend Channel pattern breakout CHAMBLFERT CHAMBLE FERTILISER LTD
Key highlights: 💡⚡
✅On 1Hour Time Frame Stock Showing Breakout of Downtrend Channel Pattern.
✅Strong Bullish Candlestick Form on this timeframe.
✅It can give movement up to the Breakout target of 401+.
✅Can Go Long in this stock by placing a stop loss below 359-.

Chambal Fertilizers - Ready for up-move.Stock gave break out from historical resistance on 26 Dec 23 with good volumes. Retest of the same completed today. A short-term long side opportunity may unfold if price breached 388 level with good volumes (preferably more than today) then stock may test 440-450 zone. sl to be kept below 367.5. RS and Volume are good. Momentum needed for trade to achieve desired target is not yet visible.

CHAMBLFERT WEEKLY CHARTCHAMBLFERT WEEKLY CHART
Cmp 342.50 Ellipse zone 332-337 MOB @ 430-450
This stock will witness a breakout on weekly charts above 337 levels on weekly closing basis.
Expected target projected by MOB.
Note : Ellipse is a combination & calculation of technical studies.
Its only an observation & not any suggestion.

Now a big really in comming In Chambal fertilizer a long moov possible.
In I see a very clear break out. All time high touch the price is soon. English is not proper but Chambal fertilizer will going up.

Chambal Fertiliser BreakoutChambal Fertiliser has given a breakout from the 2 year long consolidating range with a supporting volume.
Targeting 398/445/475
Re-Test zone 350-340

Chambal Fertlizer Near Support ZoneChambal Fertilizer is moving around a support zone and buying seems to be happening here. Deploying 1% of Capital worth the reward prospect from here.
Buy Price 270
Qty 40
Target 30-40%
Long Term 1-2 Years


Chambal Fertilizer: A good Long medium term trading Bet for 500+Chambal fertilizers. Its a Drop-Base-Rally case if crosses and closes above 333 on a weekly chart. All retracements can be bought for a target of 500+

Chambal Fertilizers - Tringle BreakoutTriangle Breakout with Strong Volume & Momentum
SL - 287
Nearest resistance- 350 to 365

Chambal Fertilizers Target : Bullish📈 Chambal Fertilizers Target: Rs. 484 🚀
📉 Breakout: Falling Wedge Pattern 👏
📊 Good Volume at Breakout 💪
💰 Buying Price: Rs. 280-290 💵
Disclaimer: Please note that stock investments carry risks. Always do your research and consult with a financial advisor before making any investment decisions. 📈💼 #StockMarket #InvestWisely

Good Risk reward trade opportunity in CHAMBLFERTGood Risk reward trade opportunity in CHAMBLFERT. Once can look trade opportunity with stoploss of 250.

Chamber ferThese are swing idea's which you can add your watchlist and analysis for yourself.
Keep on radar.
This content for only education purpose!
I am not SEBI Register.

Potential upside 20%... Chambal fertilizer Major positive deviation in RSI and ongoing consolidation around bottom level making it an investment for near term targets of 305-325-343 in 3-6months. Can evaluate to accumulate around these levels till 265-70 if it goes. Large volume deliveries also indicates a bottoming out phase.

CHAMBLFERT - Technical ViewDISCLAIMER
it's just my technical view. I'M NOT A SEBI REGISTERED ANALYST. Before taking trade or Invest consult your financial advisor.
✅Here we provide TECHNICAL Levels and Charts.💯
✅This channel is for educational and self analysis purposes only!

chambal fertChambal Fertilisers and Chemicals: Promoter Simon India revoked a pledge of three lakh shares on June 21.
increase in fii shareholding past three qtrs

Chambel fertiliser target 330Chambel fertiliser share elliot wave analysis current time price move upside 3rd wave
buy 278 stoploss 264
target 330

Chambal fertilizer is getting into buy zoneChambal fertilizer forming a flag pattern, but there's a troublesome zone above, will it cross the barrier, or not lets keep a watch, hourly close above 360, is a buy for tgt 402, sl 335

CHAMBLE FERTILIZER LONG TRADE
Stock are looking good for long. Previous day it gives Trendline breakout and make a high of 304.I am expecting 320++ in few days. I found one daily supply zone who can hold for a few time after that we reached our target.

Chambal Fertilisers & Chemicals Ltd
The company's product portfolio includes fertilisers and agri-inputs such as Urea, Di-ammonium Phosphate (DAP), Muriate of Potash (MOP), Ammonium Phosphate Sulphate (APS), different grades of NPK fertilisers, Sulphur, Micronutrients and Agrochemicals. It only manufactures Urea from its production plants and markets/ trades other fertilisers and agri-inputs through its distribution network.
Breakout above inverse head and shoulder pattern
Targets and stop loss mentioned in chart - Buy and hold for this monsoon. (short term)
Market Cap
₹ 12,218 Cr.
Current Price
₹ 294
Stock P/E
10.4
Book Value
₹ 163
Dividend Yield
2.57 %
ROCE
23.4 %
ROE
26.4 %
Face Value
₹ 10.0
Promoter holding
60.6 %
EPS last year
₹ 37.6
EPS latest quarter
₹ 7.79
Debt
₹ 6,934 Cr.
Pledged percentage
26.3 %
Net CF
₹ -356 Cr.
Price to Cash Flow
-504
Free Cash Flow
₹ -188 Cr.
Debt to equity
1.02
OPM last year
14.1 %
OPM 5Year
14.8 %
Reserves
₹ 6,371 Cr.
Price to book value
1.78
Int Coverage
7.23
PEG Ratio
0.29

CHAMBAL FERTILIZER COMPLETE PATTERN INVERSE HEAD & SOLDERChambal Fertilizer is complete pattern inverse head & solder
buy this stock 269to 270

Chambal looking good for buyChambal is under selling pressure and trading near the support zone... Price is trapped between the downtrend line and 1st major support. If the price breakout the trendline, the chances of a 25-30% rally. Keep stop loss very tight. (I am not a financial advisor, it's purely based on my analysis. Feel free to correct me in the comment box :) )
