CHENNPETRO trade ideas

inverse head and shoulders pattern bullishinverse head and shoulders pattern bullish activated
The bullish inverse head and shoulders pattern is a chart formation that signals a potential shift from a bearish trend to a bullish one
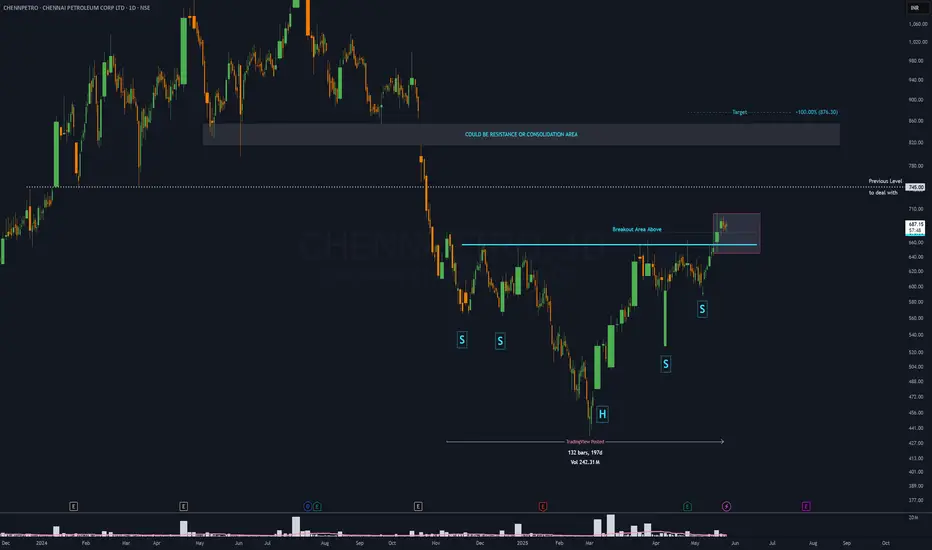
CHENNPETRO - 7 months DOUBLE HEAD & SHOULDERS══════════════════════════════
Since 2014, my markets approach is to spot
trading opportunities based solely on the
development of
CLASSICAL CHART PATTERNS
🤝Let’s learn and grow together 🤝
══════════════════════════════
Hello Traders ✌
After a careful consideration I came to the conclusion that:
- it is crucial to be quick in alerting you with all the opportunities I spot and often I don't post a good pattern because I don't have the opportunity to write down a proper didactical comment;
- since my parameters to identify a Classical Pattern and its scenario are very well defined, many of my comments were and would be redundant;
- the information that I think is important is very simple and can easily be understood just by looking at charts;
For these reasons and hoping to give you a better help, I decided to write comments only when something very specific or interesting shows up, otherwise all the information is shown on the chart.
Thank you all for your support
🔎🔎🔎 ALWAYS REMEMBER
"A pattern IS NOT a Pattern until the breakout is completed. Before that moment it is just a bunch of colorful candlesticks on a chart of your watchlist"
═════════════════════════════
⚠ DISCLAIMER ⚠
Breakout Area, Target, Levels, each line drawn on this chart and any other content represent just The Art Of Charting’s personal opinion and it is posted purely for educational purposes. Therefore it must not be taken as a direct or indirect investing recommendations or advices. Entry Point, Initial Stop Loss and Targets depend on your personal and unique Trading Plan Tactics and Money Management rules, Any action taken upon these information is at your own risk.
═════════════════════════════
Chennai Petro - A reversal betThis stock can do well in coming few days
High volume candle high acted as support

CHENNAI PETRO - LONGNSE:CHENNPETRO Weekly probably positive head shoulder looks like rounding bottom.

chennai petrothe National Green Tribunal (NGT) has temporarily stopped the Tamil Nadu Pollution Control Board (TNPCB) from collecting 736.8 million rupees (approximately $9 million USD) from a specific entity. This means the entity doesn't have to pay the fine/charge for now, while the NGT reviews the matter further. The stay is interim, meaning it's not a final decision.


Chennai Petro - Next MultibaggerChennail Petro Update !
Stock is went from 300 to 1050
Currently around 600
Stock can bounce from current levels
And May touch 1300-1500 in weeks to come
Thank You !!

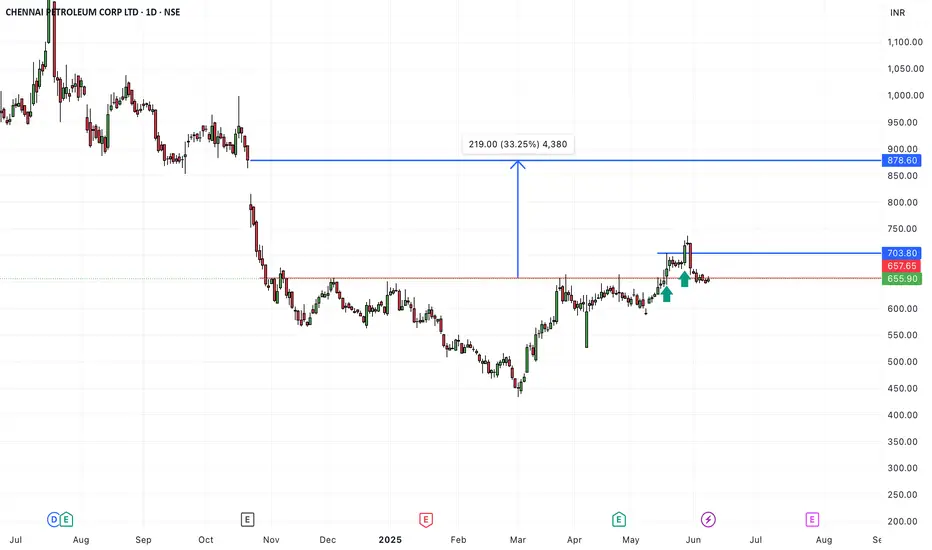
CHENNAI PETROLEUM CORP LTDA stock that was strongly bullish for the past 1.5 years started declining from August 2024. In the weekly time frame, drawing a swing-based Fibonacci retracement shows that the current price has reached the **0.618 level**.
This could be a good opportunity for either short-term or long-term investment, as the **0.618 retracement level** is considered a strong support zone where prices often bounce back. However, it's essential to confirm with additional technical indicators or market conditions before making a decision.

CHENNAI PETROLEUM CORP LTD S/RSupport and Resistance Levels:
Support Levels: These are price points (green line/shade) where a downward trend may be halted due to a concentration of buying interest. Imagine them as a safety net where buyers step in, preventing further decline.
Resistance Levels: Conversely, resistance levels (red line/shade) are where upward trends might stall due to increased selling interest. They act like a ceiling where sellers come in to push prices down.
Breakouts:
Bullish Breakout: When the price moves above resistance, it often indicates strong buying interest and the potential for a continued uptrend. Traders may view this as a signal to buy or hold.
Bearish Breakout: When the price falls below support, it can signal strong selling interest and the potential for a continued downtrend. Traders might see this as a cue to sell or avoid buying.
MA Ribbon (EMA 20, EMA 50, EMA 100, EMA 200) :
Above EMA: If the stock price is above the EMA, it suggests a potential uptrend or bullish momentum.
Below EMA: If the stock price is below the EMA, it indicates a potential downtrend or bearish momentum.
Trendline: A trendline is a straight line drawn on a chart to represent the general direction of a data point set.
Uptrend Line: Drawn by connecting the lows in an upward trend. Indicates that the price is moving higher over time. Acts as a support level, where prices tend to bounce upward.
Downtrend Line: Drawn by connecting the highs in a downward trend. Indicates that the price is moving lower over time. It acts as a resistance level, where prices tend to drop.
Disclaimer:
I am not a SEBI registered. The information provided here is for learning purposes only and should not be interpreted as financial advice. Consider the broader market context and consult with a qualified financial advisor before making investment decisions.

Chennai Petroleum's Sharp Drop Hits All Targets in 15m TradeAnalysis: Chennai Petroleum (CHENNPETRO) displayed strong bearish momentum on the 15-minute chart using Risological Swing Trader , leading to a successful short trade where all targets have been achieved.
Trade Summary:
Entry Level: 912.85
Target Levels:
TP1: 859.65 ✅
TP2: 773.50 ✅
TP3: 687.35 ✅
TP4: 634.10 ✅
Stop Loss: 955.95
Key Points:
Consistent Downtrend: The stock has followed a consistent downtrend, highlighted by the descending red moving average, indicating continued selling pressure.
Sector Impact: The broader energy sector may also be experiencing pressure, impacting stocks like Chennai Petroleum. Recent economic shifts could be contributing to the bearish outlook.
Conclusion:
The Chennai Petroleum short trade has successfully reached all marked targets. This movement reinforces the bearish sentiment in the stock, offering potential opportunities for traders monitoring short positions.

Price Action Trading Analysis: Chennai Petroleum Corp Ltd
Price action trading is a method of technical analysis that relies on historical prices to predict future price movements. In this analysis, we'll focus on Chennai Petroleum Corp Ltd (CHENNPETRO) on the National Stock Exchange (NSE). The chart spans from October 2023 to October 2024, showcasing significant trends and potential trading opportunities.
Upward Trend and Trendline Support
The chart reveals a clear upward trend with some volatility, marked by significant peaks and troughs. An ascending trendline provides key support levels, with the price bouncing off this line multiple times. This trendline acts as a reliable indicator for traders to identify potential entry points.
Key Observations
Support and Resistance Levels:
The trendline serves as a strong support, with the price repeatedly rebounding when it nears this level.
Resistance levels can be observed at the peaks where the price struggles to break through, creating potential selling opportunities.
Volume Analysis:
Volume bars at the chart's bottom indicate trading activity. Notable spikes in volume often precede significant price movements, suggesting heightened investor interest.
Analyzing volume trends helps confirm the strength of price movements and potential reversals.
Daily Price Movements:
The price action shows daily fluctuations, with the current price at INR 956.00, reflecting a change of +27.05 (+2.91%).
Monitoring daily movements and changes provides insights into market sentiment and potential short-term trends.
Trading Strategies
Trendline Bounces:
Traders can look for buying opportunities when the price approaches and rebounds from the ascending trendline.
These bounces provide low-risk entry points, with the trendline acting as a natural stop-loss level.
Breakouts:
A breakout above resistance levels, especially with increased volume, can signal the start of a new upward leg.
Similarly, a breakdown below the trendline support could indicate a reversal, prompting short-selling opportunities.
Volume Confirmation:
Confirming price movements with volume trends enhances the reliability of the signals.
High volume during upward movements suggests strong buying interest, while low volume during pullbacks indicates weak selling pressure.
Conclusion
The price action of Chennai Petroleum Corp Ltd (CHENNPETRO) showcases a robust upward trend supported by an ascending trendline. By analyzing support and resistance levels, volume trends, and daily price movements, traders can identify potential entry and exit points. Leveraging these insights helps enhance trading decisions, contributing to more informed and potentially profitable trades.

Chennai Petroleum Corporation LimitedChennai Petroleum Corporation Limited, Chennai Petroleum Q1 standalone net dips 38% to ₹343 cr.

CHENNPETRO CHANNEL MOVEMENTNSE:CHENNPETRO pattern chart pattern observation in 2024. High Volume breakouts leading to all-time highs followed by retracement and support at the bottom of the channel. Overall channel movement is in the upward direction. Possible dip for the next ATH?
Disclosure: I am not SEBI registered. The information provided here is for educational purposes only. Consult your financial advisor before making any decisions. Study is neither advice nor endorsement.

CHENNAI PETRO S/R for 18/7/24Support and Resistance Levels: In technical analysis, support and resistance levels are significant price levels where buying or selling interest tends to be strong. They are identified based on previous price levels where the price has shown a tendency to reverse or find support.
Support levels are represented by the green line and green shade, indicating areas where buying interest may emerge to prevent further price decline.
Resistance levels are represented by the red line and red shade, indicating areas where selling pressure may arise to prevent further price increases. Traders often consider these levels as potential buying or selling opportunities.
Breakouts: Breakouts occur when the price convincingly moves above a resistance level (red shade) or below a support level (green shade). A bullish breakout above resistance suggests the potential for further price increases, while a bearish breakout below support suggests the potential for further price declines. Traders pay attention to these breakout signals as they may indicate the start of a new trend or significant price movement.
20 EMA: The yellow line denotes 20 EMA, to interpret the 20 EMA, you need to compare it with the prevailing stock price. If the stock price is below the 20 EMA, it signals a possible downtrend. But if the stock price is above the 20 EMA, it signals a possible uptrend.
Disclosure: I am not SEBI registered. The information provided here is for learning purposes only and should not be interpreted as financial advice. It is important to consult with a qualified financial advisor before making any investment decisions. Tweets neither advice nor endorsement.

CHENNAI PETROL CP S/R for 16/7/24Support and Resistance Levels: In technical analysis, support and resistance levels are significant price levels where buying or selling interest tends to be strong. They are identified based on previous price levels where the price has shown a tendency to reverse or find support.
Support levels are represented by the green line and green shade, indicating areas where buying interest may emerge to prevent further price decline.
Resistance levels are represented by the red line and red shade, indicating areas where selling pressure may arise to prevent further price increases. Traders often consider these levels as potential buying or selling opportunities.
Breakouts: Breakouts occur when the price convincingly moves above a resistance level (red shade) or below a support level (green shade). A bullish breakout above resistance suggests the potential for further price increases, while a bearish breakout below support suggests the potential for further price declines. Traders pay attention to these breakout signals as they may indicate the start of a new trend or significant price movement.
20 EMA: The yellow line denotes 20 EMA, to interpret the 20 EMA, you need to compare it with the prevailing stock price. If the stock price is below the 20 EMA, it signals a possible downtrend. But if the stock price is above the 20 EMA, it signals a possible uptrend.
Disclosure: I am not SEBI registered. The information provided here is for learning purposes only and should not be interpreted as financial advice. It is important to consult with a qualified financial advisor before making any investment decisions. Tweets neither advice nor endorsement.

CHENNAIPETRO | SWING | LONG | STAGE 2Price is currently in stage 2.
It is creating a nice base near ATH.
Volume dry-up.
EMAs on Weekly TF is trending.


NSE:CHENNPETRO - Can it break way multyear high this time?Chennai Petroleum Corporation Limited is in the business of refining crude oil to produce & supply various petroleum products and manufacture and sale of lubricating oil additives.
Company has reduced debt.
Stock is trading at 0.92 times its book value
Company is expected to give good quarter
Company has delivered good profit growth of 31.1% CAGR over last 5 years
Company has a good return on equity (ROE) track record: 3 Years ROE 54.7%
Company's working capital requirements have reduced from 25.9 days to 11.0 days
NSE:CHENNPETRO
disc: No investment

Chenni petro will show 90 up side move in few days Chenni petro will show 90 rupee up move till 830 in few days we will make position as per your analysis please add in watch list

Chennai Petroleum Corporation LtdTARGET AND SL IN CHART
BREAKOUT OBSERVED AFTER 300 + WEEKS CONSOLIDATION
FUNDAMENTALS
Market Cap
₹ 7,126 Cr.
Current Price
₹ 479
52 W High / Low
₹ 492 / 186
Stock P/E
4.14
Book Value
₹ 422
Dividend Yield
5.64 %
ROCE
45.5 %
ROE
70.2 %
Face Value
₹ 10.0
Promoter holding
67.3 %
EPS last year
₹ 237
EPS latest quarter
₹ 36.8
Debt
₹ 3,760 Cr.
Pledged percentage
0.00 %
Net CF
₹ -7.10 Cr.
Price to Cash Flow
1.24
Free Cash Flow
₹ 5,331 Cr.
Debt to equity
0.55
OPM last year
7.47 %
OPM 5Year
4.03 %
Reserves
₹ 6,132 Cr.
Price to book value
1.13
Int Coverage
8.57
PEG Ratio
0.13
Price to Sales
0.10
Sales growth 3Years
27.3 %
Profit Var 3Yrs
54.7 %

Bull flag formationThere's a bull flag formation in the D timeframe and it's around a solid round number, and previous days candles seems to broke the downtrend, plus previous day it broke the 9 and 20 ema's after opening. So watch out for it.

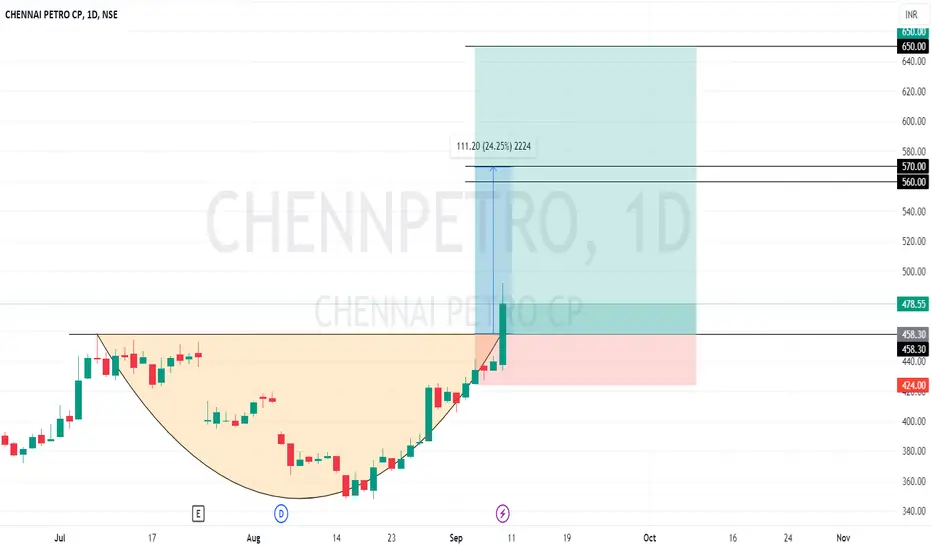
CHENNPETROCHENNPETRO Chart Analysis......11/09/23
Long : 460
Sl : 424
Target : 560 / 570 / 650
Enjoy !