CIGNITITEC - Bull run in short runhi,
this looking BULL run in the short run and two targets are mentioned and this is purely educational purpose and calculate your risk...! Kindly comments your opinions!
Next report date
—
Report period
—
EPS estimate
—
Revenue estimate
—
93.30 INR
2.00 B INR
20.14 B INR
8.98 M
About CIGNITI TECHNOLOGIES LTD
Sector
Industry
Website
Headquarters
Hyderabad
Founded
1998
ISIN
INE675C01017
FIGI
BBG000DPCT02
Cigniti Technologies Ltd. engages in the provision of software testing services. It includes quality assurance, quality engineering, digital assurance, next generation testing, and advisory and transformation services. The firm covers airlines, banking, communications, energy and utilities, financial services, healthcare and life sciences, insurance, and retail industries. The company was founded by Venkata Chakkilam Subramanyam and Sudhakar Pennam on September 3, 1998 and is headquartered in Hyderabad, India.
Related stocks
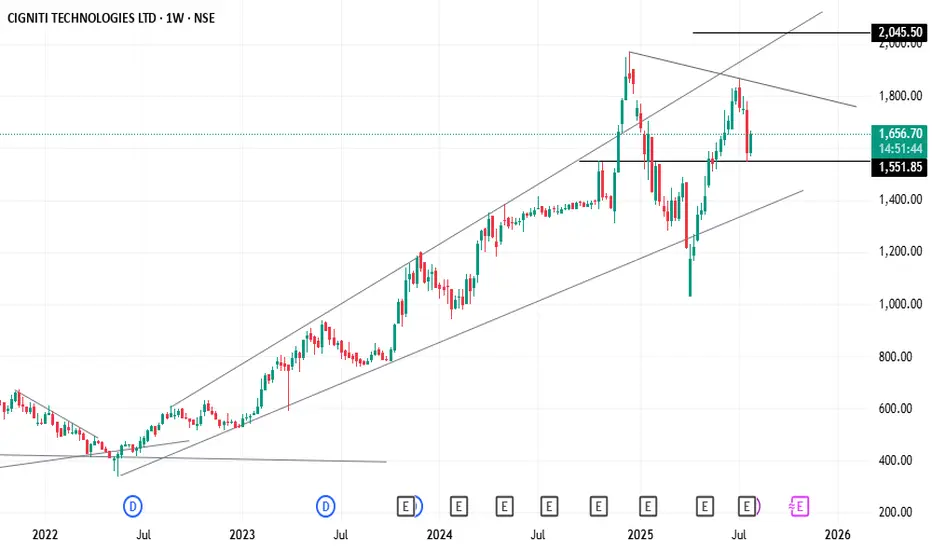
STOCK FOR SWING Cigniti Technologies Ltd (1W)
BUYING RANGE - ENTRY ABOVE 1680
STOPLOSS-1280
TARGET - 1790-1840-1900+++
Cigniti Technologies Ltd is engaged in providing quality engineering & software testing services to clients across various industries. It was incorporated in 1998 in Hyderabad, Telangana. [

CIGNITITECStock has been trading in the parallel channel for the past few months...It has tried to break its all time high levels on 03rd May...Can try again to break its all time high levels and make a new high.


NIFTY | BANKNIFTY | NITY IT | SWING TRADING STOCKSIn this video I have analyze few important indices. Nifty, BankNifty and Nifty IT.
Also, in the end i have mentioned two swing trading stocks.
Nifty
I find Nifty is bullish. The previous support is still intact.
BankNifty
I find BankNifty bearish, and can see a fall in BankNifty.
One thing

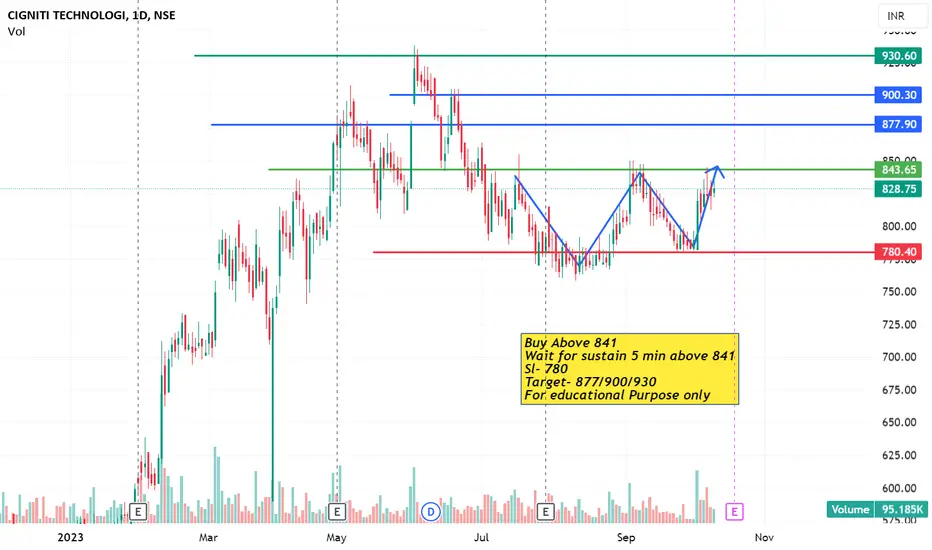
CIGNITITECBuy Above 841
Wait for sustain 5 min above 841
Sl- 780
Target- 877/900/930
For educational Purpose only
My latest pick for swing trading CignititecIt is a fundamentally good tech stock fallen by about 20% Entered for swing trading

Stock picked from Peter Lynch, Hope rebound from 200EMAStock picked from Peter Lynch, Hope rebound from 200EMA, stable growth of 15% Average.
Expected rebound. On Sell side now, expect on rebound from 740.

Cigniti TechLooks good as the trend line support is BO and being retested. Whenever candle is at the support, volumes are being seen.
SL - 750
Tragets are makers on the chart accordingly
Power of Inside Bar - Cingniti TechInside Bars if used wisely, can give us astonishing results in Trading.
Let's understand this scenario.
Stock Name - Cigniti Tech
After 20th Feb 2023, on D TF, this counter merely had any move! More or less it had inside Bars with totally squeezed close prices compared to earlier close. if you ob

See all ideas
Summarizing what the indicators are suggesting.
Oscillators
Neutral
SellBuy
Strong sellStrong buy
Strong sellSellNeutralBuyStrong buy
Oscillators
Neutral
SellBuy
Strong sellStrong buy
Strong sellSellNeutralBuyStrong buy
Summary
Neutral
SellBuy
Strong sellStrong buy
Strong sellSellNeutralBuyStrong buy
Summary
Neutral
SellBuy
Strong sellStrong buy
Strong sellSellNeutralBuyStrong buy
Summary
Neutral
SellBuy
Strong sellStrong buy
Strong sellSellNeutralBuyStrong buy
Moving Averages
Neutral
SellBuy
Strong sellStrong buy
Strong sellSellNeutralBuyStrong buy
Moving Averages
Neutral
SellBuy
Strong sellStrong buy
Strong sellSellNeutralBuyStrong buy
Displays a symbol's price movements over previous years to identify recurring trends.
Frequently Asked Questions
The current price of CIGNITITEC is 1,608.90 INR — it has decreased by −2.89% in the past 24 hours. Watch CIGNITI TECHNOLOGIES LTD stock price performance more closely on the chart.
Depending on the exchange, the stock ticker may vary. For instance, on NSE exchange CIGNITI TECHNOLOGIES LTD stocks are traded under the ticker CIGNITITEC.
CIGNITITEC stock has risen by 1.20% compared to the previous week, the month change is a −10.86% fall, over the last year CIGNITI TECHNOLOGIES LTD has showed a 17.69% increase.
CIGNITITEC reached its all-time high on Dec 17, 2024 with the price of 1,970.00 INR, and its all-time low was 156.45 INR and was reached on Aug 11, 2017. View more price dynamics on CIGNITITEC chart.
See other stocks reaching their highest and lowest prices.
See other stocks reaching their highest and lowest prices.
CIGNITITEC stock is 3.21% volatile and has beta coefficient of 1.16. Track CIGNITI TECHNOLOGIES LTD stock price on the chart and check out the list of the most volatile stocks — is CIGNITI TECHNOLOGIES LTD there?
Today CIGNITI TECHNOLOGIES LTD has the market capitalization of 44.08 B, it has increased by 0.06% over the last week.
Yes, you can track CIGNITI TECHNOLOGIES LTD financials in yearly and quarterly reports right on TradingView.
CIGNITI TECHNOLOGIES LTD is going to release the next earnings report on Oct 31, 2025. Keep track of upcoming events with our Earnings Calendar.
CIGNITITEC net income for the last quarter is 659.00 M INR, while the quarter before that showed 731.50 M INR of net income which accounts for −9.91% change. Track more CIGNITI TECHNOLOGIES LTD financial stats to get the full picture.
CIGNITI TECHNOLOGIES LTD dividend yield was 0.00% in 2024, and payout ratio reached 0.00%. The year before the numbers were 0.24% and 4.94% correspondingly. See high-dividend stocks and find more opportunities for your portfolio.
EBITDA measures a company's operating performance, its growth signifies an improvement in the efficiency of a company. CIGNITI TECHNOLOGIES LTD EBITDA is 3.28 B INR, and current EBITDA margin is 14.35%. See more stats in CIGNITI TECHNOLOGIES LTD financial statements.
Like other stocks, CIGNITITEC shares are traded on stock exchanges, e.g. Nasdaq, Nyse, Euronext, and the easiest way to buy them is through an online stock broker. To do this, you need to open an account and follow a broker's procedures, then start trading. You can trade CIGNITI TECHNOLOGIES LTD stock right from TradingView charts — choose your broker and connect to your account.
Investing in stocks requires a comprehensive research: you should carefully study all the available data, e.g. company's financials, related news, and its technical analysis. So CIGNITI TECHNOLOGIES LTD technincal analysis shows the sell today, and its 1 week rating is buy. Since market conditions are prone to changes, it's worth looking a bit further into the future — according to the 1 month rating CIGNITI TECHNOLOGIES LTD stock shows the buy signal. See more of CIGNITI TECHNOLOGIES LTD technicals for a more comprehensive analysis.
If you're still not sure, try looking for inspiration in our curated watchlists.
If you're still not sure, try looking for inspiration in our curated watchlists.