Cipla - Traingle Pattern BreakoutCipla - Traingle Pattern Breakout. Good consolidation and Final breakout. If market supports we can take short position.
CIPLA trade ideas

Technical Analysis of CIPLA : BUY"
TECHNICAL ANALYSIS OF NSE: CIPLA
The LAST CLOSE PRICE of NSE: CIPLA is 952.95. The PARABOLIC SAR is showing the UPWARD SIGNAL with TREN D as UPTREND . The FIBONACCI LEVELS analysis shows that the CLOSEST FIBONACCI LEVELS is 0.618 at the FIBONACCI STOCK PRICE LEVEL of 954.25. From here, the Key Support and Resistance levels are SUPPORT 1 at 949.5, SUPPORT 2 at 934.8 with RESISTANCE 1 and RESISTANCE 2 at 970.4 and 997 respectively. The Key 50% FIBONACCI LEVEL stands at 934.8 which is the crucial Fibonacci Level determining whether the scrip will maintain the trend or not.
The STOC RSI has the values K and D as 81.92 and 83.66 respectively. At this level it the status is OVER BOUGHT . When we look at the Moving Averages, MACD is the crucial indicator to look into. With MACD VALU E at 7.77 and SIGNAL at 4.02 along with HISTOGRAM showing values of 3.73, the STATUS is clearly UPWARDS .
The best indicator to determine the Trend Reversal is FISHER TRANSFORM and currently the values of FISHER and TRIGGER stand at 2.27 and 2.22 with SIGNAL as TREND CHANGED TO BUY . A very important factor while making the investment is to see if there has been already too much of Buying or Selling, and that are we entering too late into the transaction or not. Thus, with WILLIAM's R% value at -0.1525 the STATUS is OVER BOUGHT.
No one wants to buy costly things, and thus always look for the bargain or appropriate price levels to buy things. Same applies to Stocks, however the only exception would be some Hot Stocks that one wants to have any price. Looking at this perspective, the P/E RATIO of the stock stands at 30.32 which signifies its Price Level to be AVERAGE.

am i lateral entry ! ..i) kindly do your own research before buy the share
ii) follow the news till reach the target


CIPLA as on 25.09.2021A GOOD UPTREND IN ONE DAY CHART!!
AND A GOOD CONSOLIDATION IS BEING FORMED FROM AUGUST!!
Wait for breakout of consolidation!
If it breaks the resistance level that is 988 then wait for any short retest and can have a small target!!
TARGET=1086/1100
STOP LOSS=921/930
And if it breaks the uptrend support line then do not buy as the stock can retest and go for filling gap which is at 542 level!!
So wait for a true breakout and do check VOLUME!!
And if breaks down then go for short trade in 15 min time frame !!
50 ema and 200 ema giving good support to stock!!
Can check MACD for more confirmations!
AND daily and weekly pivot are near our target !!
So just wait for a true breakout!!
(The above analysis is only for study purpose do not take it as any buy or sell call!!)


CIPLA 30min chart Inverted Triangle Wave 24 Sept 2021CIPLA 30min chart forming a possible Inverted Triangle Wave 24 Sept 2021

Cipla buy for intraday tradeCipla has broken the recent resistance level and take support on resistance so now that resistance becomes a support for stock so we will buy Cipla for intraday. I am not suggesting sell for this stock

CIPLA - Momentum stock for 23rd Sep 2021Cipla has good setup for going long
stock is still trading above 200DMA , also RSI on daily basis is just crossing the 60 level.

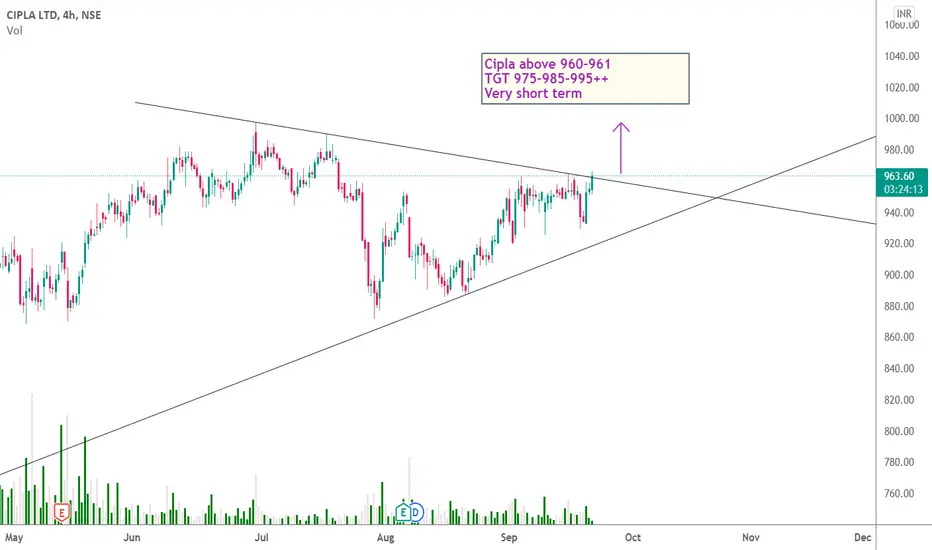
My view on CIPLACipla giving trendline breakout.Cipla above 960-961
TGT 975-985-995++
Very short term
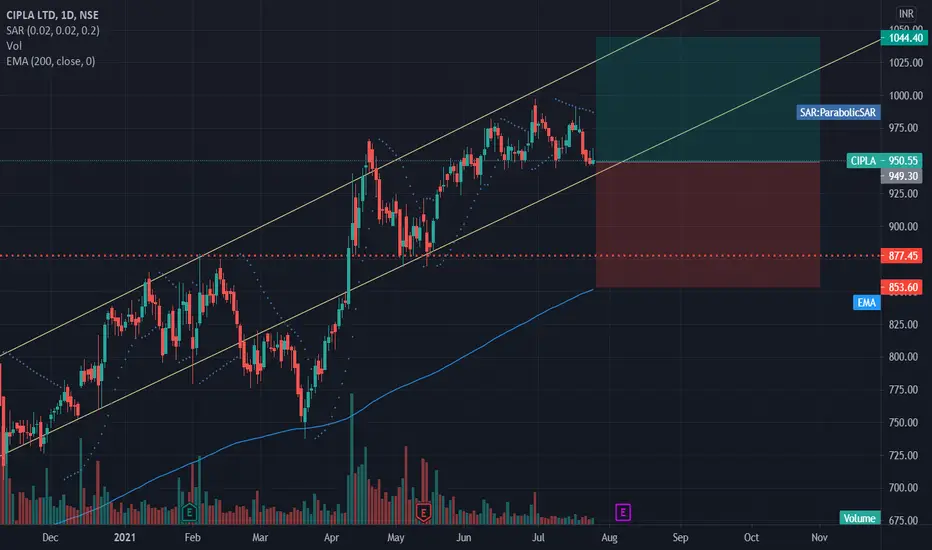
Cipla Reversal RallyThe stock has broken down from the previous pattern but found support around 875. Trade is supported by brokerage calls and Supports Nearby including 200 EMA.
Risk Reward Ratio - 2:1
SL is placed below the support zone, Lower Trendline and 200 EMA. The target is placed near swing high.

Price ActionTrend lines can be used to trade, if it closes beyond those trend lines trade can be taken respectively


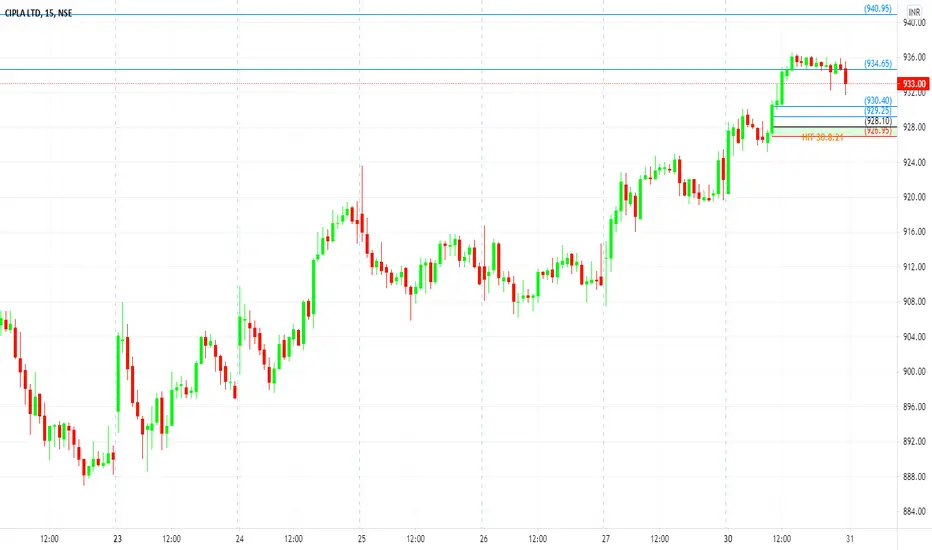
Ready For BreakoutReady For Breakout We can see the level of 940 easy
Note *This is only for information and educational purpose. Please consult your financial advisor before investing.
Investing has its risk and require professional advise, please do consult advisor before investing.

VIEW929.90 is the level. Trade for at least 50 points upside. You can see 2 reasons counter-trendline breakout and cup and handle pattern. This is a positional trade.

CIPLA:: Breakdown: Technical Analysis using Rising WedgeIn the Daily timeframe, Cipla formed a rising wedge which means buyers are aggressive to move the market UP but they get exhausted and at one point Sellers became dominant, and finally support broke.

CIPLA DAILYBullish Bat at strong support level
Within 3-5 price bars need the confirmation from a Bullish CANDLE with RSI ABOVE 30
in shorter 1HR time frame can look for intraday trade with confirmation
POTENTIAL BUY

CIPLA Short Term ReversalThe stock has reached lower trend line and took support and is ready for a reversal rally. Trade is supported by brokerage calls and swing low, major supports & 200 EMA before SL levels. Target is placed with a risk reward ratio of 1:1.


Cipla - swing tradeThe current Price action structure suggesting that the stock is might be moving towards its recent highs near 980- 1000 levels.
The said Probability will be valid as long as the stock is trading above 958 levels.

Cipla One can go long with Stop-loss of 955
All the key levels are mentioned in chart with Stop-loss and Targets
Disclaimer
I am not sebi registered analyst
My studies are Educational purpose only
Please consult with your Financial advisor before trading or investing
