C I P L ACIPLA fut is on the verge of breaking out of classic triangle pattern on an hourly chart with superb OI addition suggesting long build up.
Risk:-Reward = 1:3
could be bought with mentioned stoploss & target
CIPLAM2025 trade ideas

Breakout in Cipla?Potential breakout in Cipla?
Let's understand.
Candle made yesterday followed by the candle made today indicates a lot of strength. Both the candles are big green candles backed up with big green volume bars. This gives me a hint that the resistance zone between 1520 and 1525 might be broken now and we might see a strong breakout.
Coming to my momentum indicator, RSI, it is moving in the buy zone now. We generally consider the zone between 40 and 60 as neutral and RSI is just breaching the 60 mark.
So, I will buy as and when I get a new buy signal in the hourly chart with SL below 1470 and targets above 1525.

I've gone long in Cipla#Educational purpose only
I think the first hourly candle made yesterday is strong and the low won't be broken. I have explained my analyses in the video and I hope this helps.

Looks like Cipla might be the buy for tomorrow.#Educational purpose only
I've analyzed the chart of Cipla because of the strong bullish candle made today in the daily chart.
I think it will be a good buy above 1450 for targets of 1550 or more.


CIPLA..READY FOR BIG MOVECIPLA NEAR TO WEEKLY HIGH..HIGH VOLUME AND ATR INDICATING FOR BIG MOVE...1st Target 1698
2nd target 2048..duration 6 months

Long in ciplaIndian stock cipla future is taking reversal from bottom in weekly chart.it was also a good demand zone.
We will see 1100/1250 levels very soon .
Future of medical sector in India is very good.
So we can make a long position in Indian medical stock cipla.

CIPLA broke the trendline RSI 50 level is failed in hourly time CIPLA broke the trendline
RSI 50 level is failed in hourly time frame
it may test lower fib level before its higher tf retracement complete

cipla futuresCipla Futures made flag pattern on daily charts & trading above breakout level with good OI addition of over 2.5% as well as trading above 9-21 MA & above middle bollinger band.
Could be bought positionally with stoploss of 1025 & minimum targets of 1075/1095

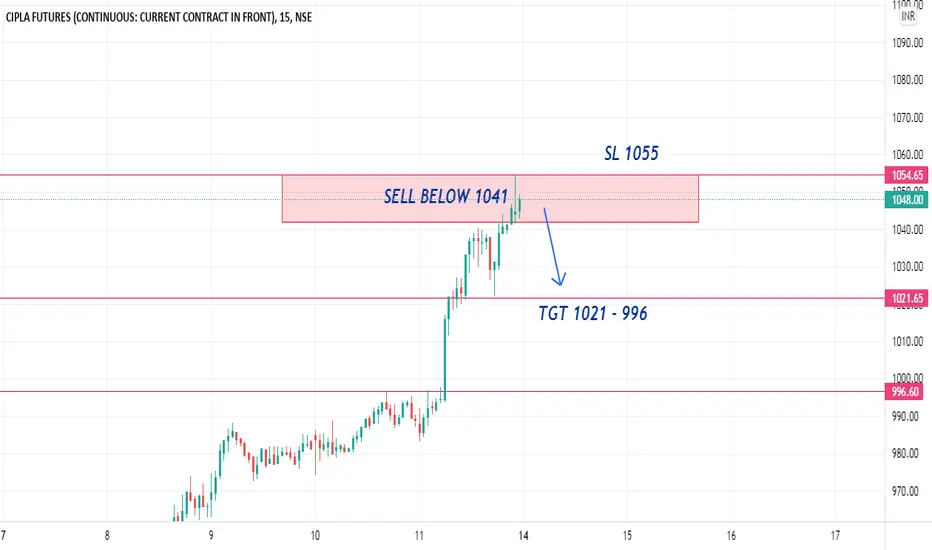
#CIPLA POSSIBLE TO SELL#CIPLA trading 1048 formed bulish patern,
yesterday trading our retracement level,
we can SELL BELOW 1041 and tgt for 1021,
posistional tgt 996 and
follow SL 1365 closing basis
Breakout of daily trendline, Reversal from 200 SMARebound from 200 SMA, breakout from daily trendline, Very strong results. Can use previous daily trendline resistance as stop loss of 912 for a target of 940.

R-0234 CIPLA breaking out from ascending triangle on daily chartCMP 820 (JAN EXPIRY) TGT 870/910 SL 772
#It is near all time high 829.
# short term moving average is above medium to long term average.
#Pharma sector is outperforming in last few months.
#DMI indicator turns bullish on the daily chart.
#RSI and MACD also indicates strength on daily and weekly chart.

Cipla looking bullishSell Cipla OCT 760PE @18-20 for the tgt of 10/8 SL 22-24 or according to ur risk profile.
Put Oi increasing all strikes upto 790 whereas call unwinding seen in 790 and above strikes.
