CMSINFO NSE:CMSINFO
Good Company Providing services to bank, financial institutions, extra.
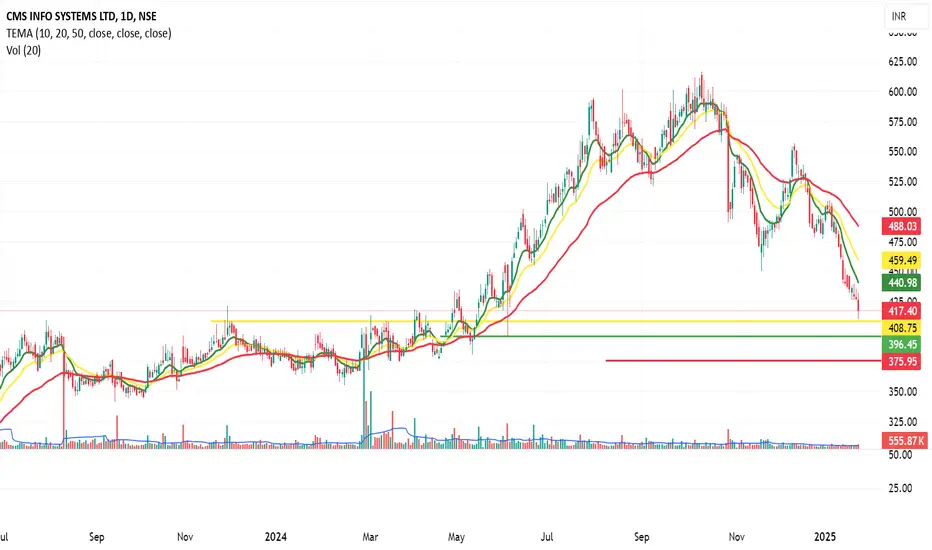
Corrected 32% from top
Rsi is in oversold =21
Buy on CMP and add on dip till 395
Sl- 375
TArget is 600+
once crossed 450 on daily closing basis.
CMSINFO trade ideas
50 SMA Rising - Positional TradeDisclaimer: I am not a Sebi registered adviser.
This Idea is publish purely for educational purpose only before investing in any stocks please take advise from your financial adviser.
It 50 SMA Rising. Suitable for Positional Trading Initial Stop loss lowest of last 2 candles and keep trailing with 50 days SMA if price close below 50 SMA then Exit or be in the trade some time trade can go for several months.
Be Discipline because discipline is the Key to Success in the STOCK Market.
Trade What you see not what you Think

CMS Infosystem Might become your favorite pick of the yearCMS Info Systems Ltd. has shown significant price movement.
Recent Performance: The stock increased by 3.18%.
Support and Resistance Levels:
- Support: ₹502.90
- Resistance: ₹565.25
Moving Averages:
- 10 EMA: ₹526.12
Key Financial Metrics:
- PE Ratio: 21.75
- EPS: ₹24.74
- Market Cap: ₹8,750 Crores
- Recent Earnings: FY 2023-2024 revenue ₹3,250 Crores, with PAT of ₹275 Crores
Entry, Exit, and Stop Loss:
- Entry Point: Above ₹540 if signs of recovery are shown
- Exit Point: Near ₹565 (resistance level)
- Stop Loss: At ₹510
Disclaimer - Not a Buy/Sell Recommendation.

CMSINFO LONGIt has retested the BO level again. and it almost tested the bottom of the channel yesterday. Do your own analysis before entering any trade.

CMS Infosystem: Triangular Breakout with Dividend BoostChart Pattern:
CMS Infosystem is forming a triangular pattern, a potential indicator of upcoming price movement.
Support Levels:
The stock has built a strong base at key support levels, suggesting a solid foundation for upward movement.
Critical Resistance:
A close above 435 could trigger a significant price increase, breaking out from the triangular pattern and signaling bullish momentum.
Upcoming Catalyst:
The upcoming dividend declaration could serve as a positive catalyst, potentially driving the stock price higher.
Trade Setup:
Entry Point: Consider initiating a long position if the stock closes above the 435 level, confirming the breakout.
Stop Loss (SL): Set a stop loss below the lower trendline of the triangular pattern to manage risk.
Target Levels: Identify initial targets at previous resistance levels. Adjust further targets based on the stock’s performance and market conditions.
Disclaimer:
Before taking any position, consult your financial advisor to ensure the trade aligns with your investment strategy and risk tolerance. This analysis is for educational purposes only and does not constitute financial advice.
Happy Trading!

CMS Infosystem - A undervalued stock for long time.This company belong to Cash Management services. Also have good presence in software for ATM's. Good presence in India.
Fundamentally stock is trading at PE of 20. Which itself is a good sign. We might see a good trend in this stock.


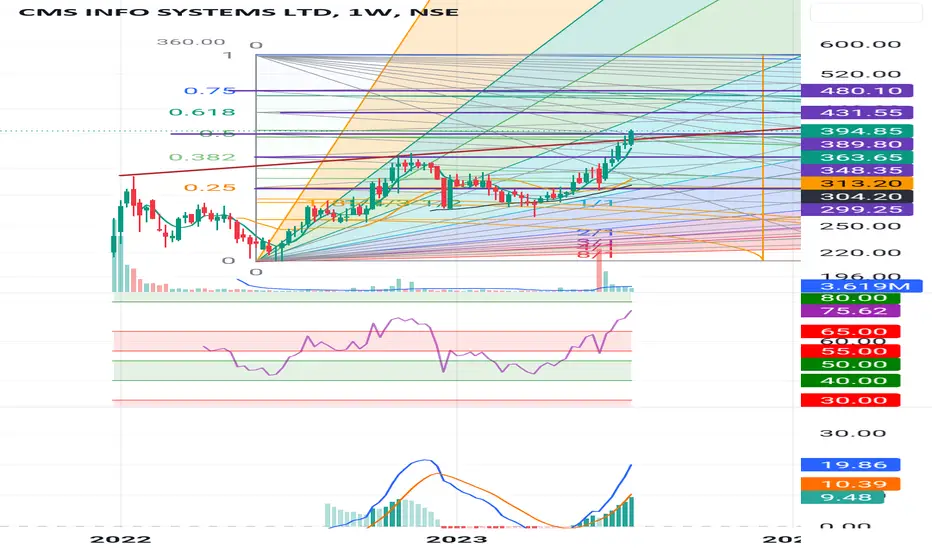
As per wave theory.
As per wave analysis the correction wave is over and there are possibility that a new 5 wave dominant wave will begin. As per Theory correction could not be more then the 4 wave bottom which is around 341.30. And we also see a doji Candle is there and next week there is follow-up buying. So keeping an SL around 340 on closing bases this can be a good stock to have in portfolio.

Trade Idea in CMS Info
Here we can go for an Upside View in NSE:CMSINFO as it broke out of the falling wedge Pattern with a good Surge of volme
Area: Stocks
Type: Buy ✅
Trade: NSE:CMSINFO
Entry: 380-389
Exit 1: 408
Exit 2: 420
SL : 363

CMS info systems - Investment ideaNothing much to explain in this simple chart, regularly making higher highs and higher lows. Fundamentally available at 20 PE and mgt is confident to continuously grow 20-25% for next few years. Bull market is going on, PE rating of this business is inevitable. I am making investment positions in this stock and suggest to the same. Stock price has full potential to double in next 3 years.

CMSInfo Trade Analysis 📈 CMS Info Trade Analysis Update:
CMS Info is currently trading very close to the 15-minute demand zone, our execution time frame. Let's break down the analysis:
Key Time Frames 🕒:
Execution (15 min): Trading near the 15-minute demand zone, marking our entry point.
Intermediate (75 min): On the 75-minute chart, the stock aligns with an upward trend.
Daily: A glance at the daily chart reveals a robust uptrend.
Trade Strategy 🚀:
Entry: Plan your entry at the 15-minute demand zone.
Exit Levels: Entry and exit levels are clearly marked on the 15-minute chart for precise execution.
Why It's Powerful 💪:
Upward Trend on Higher Time Frames: Daily and 75-minute charts both signal a strong upward trend.
Lack of Significant Supplies: Absence of notable supplies on higher time frames strengthens the trade setup.
Risk and Reward: With a risk-to-reward ratio exceeding 1:4, this trade holds significant potential.
📝 Note: This analysis is for educational purposes only. Trade responsibly.
Trade Smart, Trade Confidently! 💹✨

CMSINFO If stock price 401 this leval broken & day closing above than bullish movement see in coming days!
These are swing ideas which you can add your watchlist and analysis for yourself !
Keep on your radar!
This content only education purpose!
❗I am not sebi ragister❗

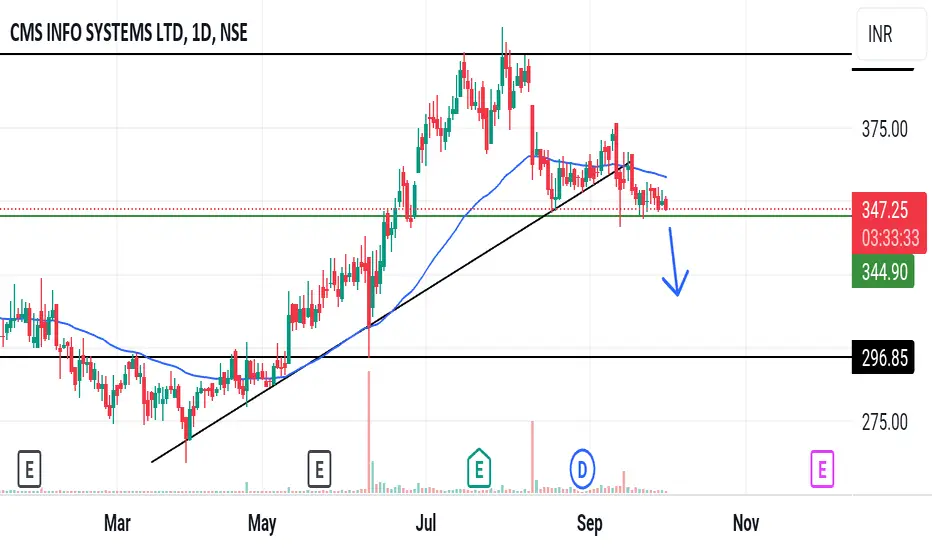
CMSINFOCMP-347
If 345 leval day closing candle than bearish movement see in future!
1.50 moving average dawntrend
2. Trendline breakout & retest
These are swing idea's which you can add your watchlist and analysis for yourself.
Keep on radar.
This content for only education purpose!
I am not SEBI Register.
CMS Info Systems is moving with styleCMS Info System Ltd. is a leading cash management company have business in Cash logistics solutions, ATM management services, Card Personalization and Remote Monitoring Solutions. The company has more than 22,000 ATMs under its management services and more than 50 public and private banks such as Axis Bank, HDFC Bank, ICICI Bank and many more.
CMS Info System CMP is 362.15. The Negative aspects of the company is promoter holding decreasing. The Positive aspects of the company are improving annual net profits, no debt, improving cash from operations annual, FIIs are increasing stake, MFs are increasing stake and zero promoter pledge.
Entry after closing above 367. Targets in the stock will be 375 and 384. Long term targets in the stock will be 398 and 409. Stop loss in the stock should be maintained at closing below 341.
The above information is provided for educational purpose, analysis and paper trading only. Please don't treat this as a buy or sell recommendation for the stock. We will not be responsible for any Profit or loss that may occur due to any financial decision taken based on any data provided in this message.

CMS INFOMaking double bottom pattern. confirmed two days back. also making cup type pattern. best buy @ 358 if this stock retest this level.
it has gud potential upside target. follow strick sl& proper risk reward ratio. this is the only holy grail in the market.
sl 340


CMS Info SystemsHas given a trendline breakout(from its inception) and looks good for a good rally
Positives
Weekly candle Closing above Gann levels
FII's and DII's increasing their stake in June
CMS Infosystem-Nice BreakoutCMS Infosystem-Nice Breakout
Capital to be deployed- 20k
Investing Price -392-94
Breakout Price -392
Stoploss -352
Targets - 528
#cmsinfosystem #StocksToBuy #StocksInFocus #StockMarket #stockstowatch #StocksToTrade

cmsinfo in an upward movementOn 26.12.2022 the stock bounced from a low of 270.10 with a big bullish candle on the 4 HTF.
This big bullish candle indicates the institutional buying meaning this would be a good demand zone.
The stock then made a high of 270.10 before moving in a sideways zone for the next one month and the downtrend had begun.
The stock moved towards the demand zone. Now on 28.02.2023 there was an entry of institutional orders which has taken the stock out of the demand zone.
With this buying coming into place we can anticipate the prices to move higher.
Buy @/above 295
Target = 310/320
Stop Loss = 270
Investments in stock market are subject to risks.
Past performance of stocks is not indicative of their future performance.
We make no representation/s or warranty/ies, express or implied, as to the accuracy, completeness or reliability of any information compiled herein, and hereby disclaims any liability with regard to the same, including, without limitation, any direct, indirect, incidental or consequential loss.
Investors are requested to review the stocks before investing.

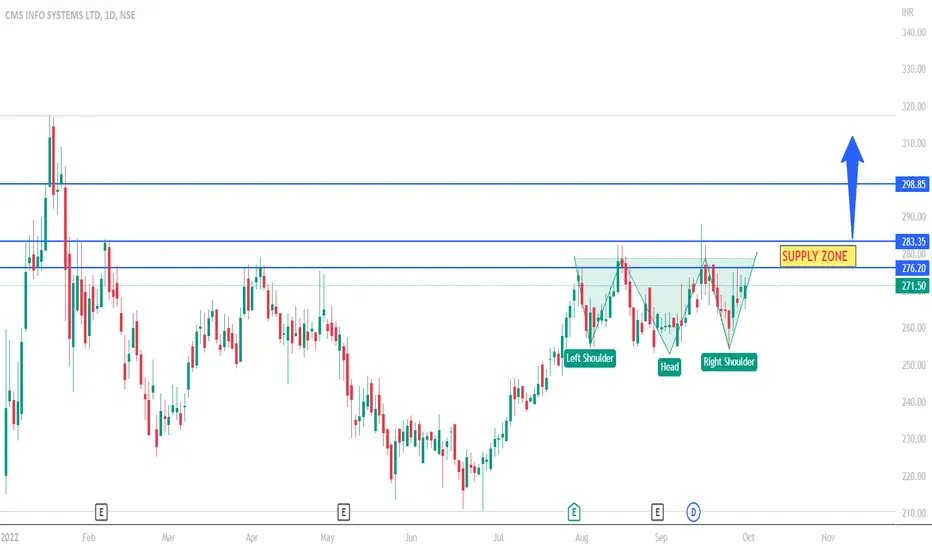
CMSFundamentally good script !!
Breakout above 283 , will bring 298 and 317 !!
Miniature Head and shoulder pattern formed in daily chart !
Wonderful breakout in CMS info both in Daily and Weekly charts.Please do your due diligence before entering in this stock.

IPO base - 1st ever Break outRecently listed IPO breaking out from the first base shows the recent demand for the script. Purely for swing purpose. can Head higher to 385 - 485 levels in coming days.
PS - Views are personal and for educational purpose only.

#CMSINFO CMSINFO#educational purpose only
#CMSINFO CMSINFO #CMSINFO CMSINFO #CMSINFO CMSINFO #CMSINFO CMSINFO #CMSINFO CMSINFO
#long
