NIFY200 - CIRCLE OF CONFLUTION NIFY 200 representing much more broader market shows and throws interesting pattern. The circle range 7600-8000 range currently at 7860. Shy of 2% move. A break above 8000 (more probability) would push it towards the 8300-8400 area. While break of 7600 looks possibility but less probable. At best market may move in range. Today's action is crucial. In sum no need to panic yet on the big picture. Stay invested
CNX200 trade ideas

Bullish Bat Pattern on Daily Chart of Nifty 200 indexBullish Bat Pattern on Daily Chart of Nifty 200 index

NIFTY200/SENSEX...Pullback in a wave ((iv))!Hello Traders,
thank you all for your comments and feedback to the video issue. I decided to turn back to the one with written words. As we all see now, it is very helpful to comment and/or give feedback at anytime. Again, thank you for your support.
Lets analyse today NIFTY200, which in my view shows the clearest pattern at moment for Indian Markets, as did SENSEX too.
By following the DOW Theory it is not really important from a traders perspective to analyse the same marketd in any timeframe, because at DOW Theory the broader market rise or decline in unison. So I always look and check the markets for the clearest wave structure and this one will be the favorit for today. Tomorrow is another day and maybe another market is the one I analyse.
On a Weekly timeframe NIFTY200 shows a „bearish Engulfing“ by ending last week. Normaly a 2-3 week decline is the consequence of that reversal pattern. So for now, the second red candle is painted at chart, and a kind of a „Doji“ candle has occur. This implies a „uncertain“ behavior of traders.
By observing RSI (14) you will notice that the indicaror is trading above 50 area, which indicate for now an intact Bull market is in place and just a pullback is on the move. This is the message as long RSI is trading above that level by weekly close.
The top at NIFTY200 @ 6078.75 reached to nearly the 1.618 FibRT at 6122.40 and fullfil in acceptable manner the guideline for an extending wave ((iii))! A pullback to the zone @ 52xx is the 0.382 FibRT of the distance at the complete lenght of wave ((iii)) and a common target zone for a wave ((iv)) pullback.
More bearish potenciall exist and the „MoB“ (Make or break) for the impulsive count is the high of wave (i) at 4774.0! If this level will be touched just by one tick onother pattern is on the move and we have to anaylse new.
By observing SENSEX (not shown) you will see the same pattern as there is a „bearish Engulfing“ and the end of an advance within a wave ((iii)). Here the „MoB“ for the impulsiv pattern is placed at 30024. RSI is also trading at 54 and the message is the same as it is for NIFTY200.
If there is the possibility for traders to view the ADL (Advance-decline-line) to chart, observe this helpful tool to analyse, because the ADL often top out befor markets did at the end of a long advance.
So thats it for a quick note ( :-)).
Have a great weekend...
ruebennase
Questions and Comments are welcome!
Note!---> This analysis can be wrong. It is just in my view the one with the most probabiltity with the Data which are available to me and by my interpretation of the EW Theory. If you trade this it is done by your own risk and decision! Keep that in Mind!!!!
Data by NSEIndia.com and moneycontrol.com!

NIFTY200/SENSEX...Wave ((IV)) in progress?Hello Traders,
please have a look to my analyse of both Indexes!
Feel free to ask or comment....
Have a great weekend...
ruebennase
Questions and Comments are welcome!
Note!---> This analysis can be wrong. It is just in my view the one with the most probabiltity with the Data which are available to me and by my interpretation of the EW Theory. If you trade this it is done by your own risk and decision! Keep that in Mind!!!!
Data by NSEIndia.com and moneycontrol.com!

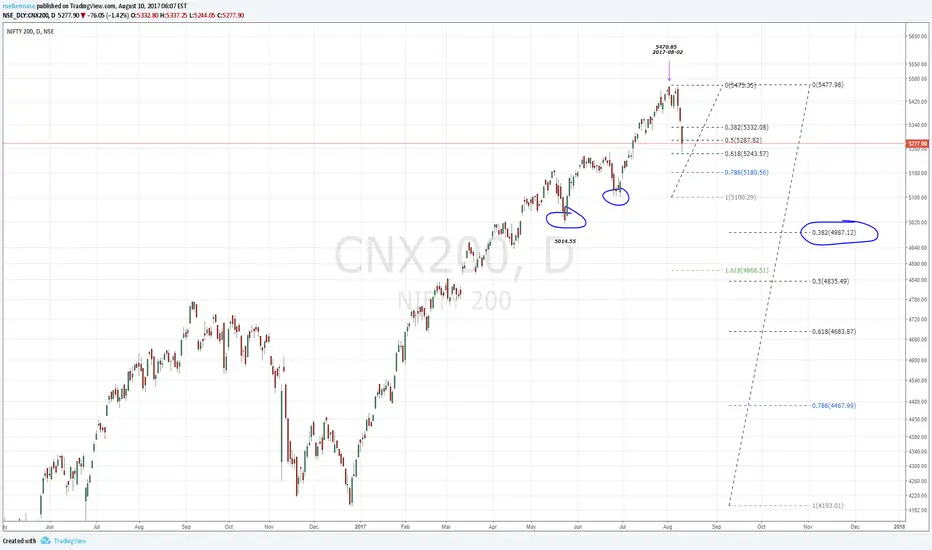
NIFTY200; Daily...still to observe with more trouble ahead?Hello Traders,
as I wrote some hours ago traders create a "bearish Engulfing" on a Daily basis at NIFTY200! This reversal Candle got played out and decent sales pressure comes into play. By not counting the Index it still looks for more trouble ahead just even a countertrend push is to expect! The RSI dropped well below the 50 point zone but still hase the chance to reverse and move back into bullish territory (50 point zone and higher)!
Today`s low at 5244.054 meet the .618 RT of the last advance! I will wait for a clearer view if this is part of a larger correction or at least the decline is done!
Have great day...
rubennase
I show this Index because it represents a broader market as for excample the "ishare MSCI Small Cap India Fund" did too!