CNX500 trade ideas


THE REALITY!You cant beat the Index fund in Long term growth....Compare your portfolio with Major Indices
Warren buffet Quote - You can't Beat S&P500 Index

CNX500 – 30-Min Long Trade Setup !📌 🚀
🔹 Asset: CNX500 (Nifty 500 Index)
🔹 Timeframe: 30-Min Chart
🔹 Setup Type: Bullish Reversal Trade
📌 Trade Plan (Long Position)
✅ Entry Zone: Above ₹19,919 (Breakout Confirmation)
✅ Stop-Loss (SL): Below ₹19,585.45 (Invalidation Level)
🎯 Take Profit Targets:
📌 TP1: ₹20,333.35 (First Resistance Level)
📌 TP2: ₹20,887.00 (Extended Bullish Move)
📊 Risk-Reward Ratio Calculation
📉 Risk (SL Distance): ₹19,919 - ₹19,585.45 = ₹333.55 risk per unit
📈 Reward to TP1: ₹20,333.35 - ₹19,919 = ₹414.35 (1:1.2 R/R)
📈 Reward to TP2: ₹20,887.00 - ₹19,919 = ₹968.00 (1:2.9 R/R)
🔍 Technical Analysis & Strategy
📌 Descending Trendline Breakout: Price has broken out of a downtrend, signaling a potential reversal.
📌 Support Rejection: The price tested ₹19,919 support and showed buying pressure.
📌 Volume Confirmation Needed: Ensure high buying volume when price holds above ₹19,919 to confirm bullish momentum.
📌 Momentum Shift Expected: If price remains above ₹19,919, it could push toward ₹20,333.35, and further to ₹20,887.00.
📊 Key Support & Resistance Levels
🟢 ₹19,585.45 – Stop-Loss / Support Level
🟡 ₹19,919 – Breakout Level / Long Entry
🔴 ₹20,333.35 – First Resistance / TP1
🔴 ₹20,887.00 – Final Target / TP2
📉 Trade Execution & Risk Management
📊 Volume Confirmation: Ensure high buying volume above ₹19,919 before entering.
📉 Trailing Stop Strategy: Move SL to entry (₹19,919) after TP1 (₹20,333.35) is hit.
💰 Partial Profit Booking Strategy:
✔ Take 50% profits at ₹20,333.35, let the rest run toward ₹20,887.00.
✔ Adjust Stop-Loss to Break-even (₹19,919) after TP1 is reached.
⚠️ Fake Breakout Risk
❌ If the price fails to hold above ₹19,919 and drops back, exit early to avoid losses.
❌ Wait for a strong bullish candle close above ₹19,919 before entering aggressively.
🚀 Final Thoughts
✔ Bullish Setup – Bouncing from support at ₹19,919 suggests a potential reversal.
✔ Momentum Shift Possible – Watch for volume confirmation.
✔ Favorable Risk-Reward Ratio – 1:1.2 to TP1, 1:2.9 to TP2.
💡 Stick to the plan, manage risk, and trade smart! 🚀📈
🔗 #Nifty500 📉 #StockMarketIndia 📊 #TechnicalAnalysis 🔍 #NSETrading 📈 #SwingTrading 🔄 #BullishSetup 🟢 #TradingView 🚀 #MarketTrends 📊 #ProfittoPath 💰 #RiskManagement ⚠️ #TradingCommunity 🤝

$NSE:CNX500 analysisNSE:CNX500
inverted cup and handle formation
Retest and breakdown could be forseen

Nifty 500 Looks set for a bounce. A sharp one.Nifty 500 looks set to break the local high it created before falling and is set to bounce 1300 points from here. However, this bounce would be used to exit and would eventually become a sell on rise opportunity for institutions. Use this bounce to exit longs, as we head in to choppy few months.

RSI OFFERING SOME VALUABLE INSIGHTS ON 2-DAY TF CHART OF CNX500The broader market, CNX 500, on this 2-day timeframe (I had to use this timeframe as the platform doesn’t accommodate complete data on daily timeframe and identified some surprising structure) when Momentum Indicator, RSI (standard 14 period) breaches below 25 and turns up that indicates the end of the market crash, and the beginning of a new uptrend. Of course, RSI doesn’t go below 25 that often, except in severe crashes. Since 1999 (when the index was introduced) there were only 3 such occasions – the dotcom crash, the Financial Crisis crash, & the Covid crash. Important point to note is that this tendency of momentum extreme on the other side – RSI above 75 - does not indicate any such reversal of the uptrend. For example, after the Covid crash RSI went above 75 over half-a-dozen times but the trend has been intact. Pl. check the chart.
Disclosure: I have not checked the validity of this structure on other indices or securities. For now, this is just for the CNX 500. On the Nifty 50 also it is mostly true though not as clear cut as that for the CNX 500.

Nifty 500 is developing an Ending Diagonal? ED occurs at the end of an Impulse. Falling volume in wave e is an additional sign of loss in momentum. An actual price reversal is needed to confirm the pattern in the coming days.

NIFTY500 QUARTERLY CHARTNIFTY500 QUARTERLY CHART
As marked by the ellipse, the mentioned levels have acted as resistance in previous two occasions & is likely to see some profit booking going forward in NIFTY 500 INDEX.So a caution advised.
Its only my observation & not any suggestion or recommendation.

Nifty 500Unfortunately, less importance is given to this index by the community.
May be because we do not have FO segment for this broader index.
Things will change though, as India is shining.
Best to watch it for study purposes.

Nifty 500 broad market indiceThis is an attempt to visualize. BMI which is having largest domain of the Indian Stock Market.
As disclosed in the chart drawing, I feel, it has broken the zone and now testing the same.
It is worth watching the indices for study purpose.

Nifty500 - Sideways/DownUntil we see a breakout on the Relative Momentum trendline in the bottom half of the chart, the market breadth wont go up.
Interesting times.

NIFTY 500 is going downSince the year 2000, when NIFTY 500 was born, the last peak was always touched before upwards and onwards. That is the entire living history of NIFTY.
NIFTY 500 is the broadest perspective of the market, so there's a 90% chance your stock is in this index.
This time, it's different?

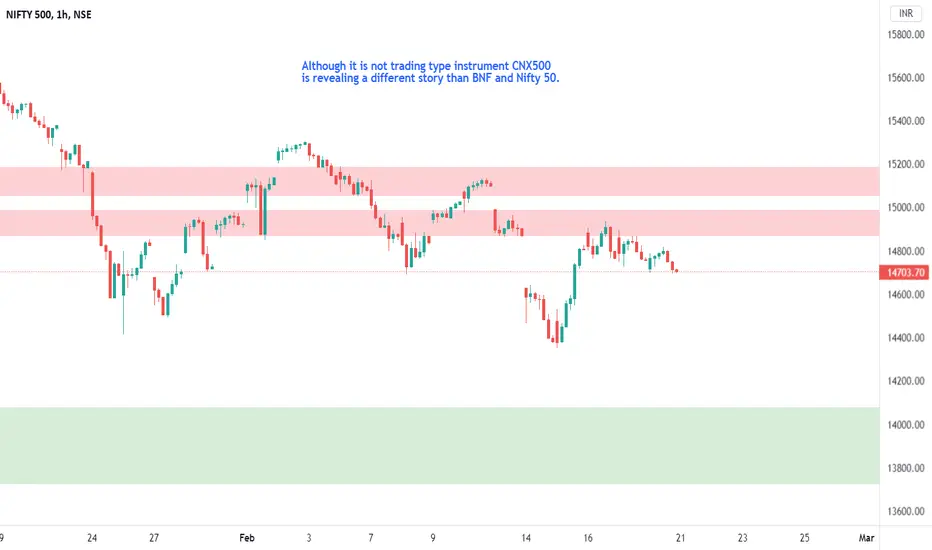
CNX500 IndiaCNX500 / Nifty 500 largest domain BMI is revealing a contra story.... One must look at it I feel.
NIFTY500 may outperform the S&P500
RSI has shown a descending triangle - upward breakout
TSI has already given a +ve crossover and now has moved over the 0 line
Similar signal in KST Indicator
Waiting for action signal on NIFTY500 is must before long entry is made
*********************************************************************************************
DISCLAIMER: I am not a SEBI registered investment advisor.
This content is for educational purposes only.
Invest capital at your own risk only after doing your own due diligence
*********************************************************************************************

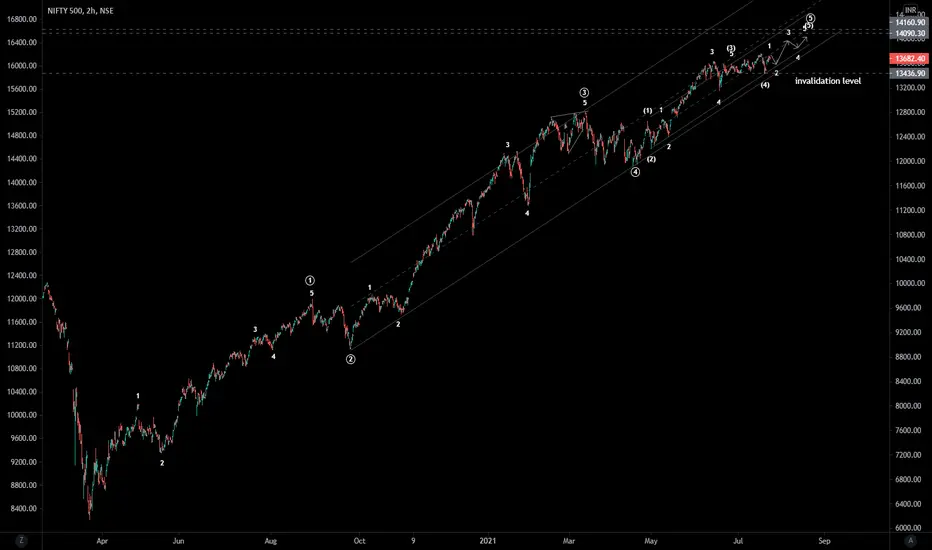
Nifty CNX 500 index - 5th of 5th wave It is in 5th of 5th wave until price remains above 13436 and target would be above 14100 approx..

CNX Nifty 500Nifty 500 is a large domain index, it tend to guide overall sentiment of the Indian Market. Will be watching it approaching an important support zone twice.

8860 very important 8860 to 8800 will act as good support for border market. It will hold if nifty hold above 10600.


NIFTY 500 15M HOLY GRAIL TRADING SETUPAdd ADX with 14 period
Add 20 SMA
Watch for these to setup trade
ADX above 30 level (manually add 30 level)
Price above 20 sma
Wait for a pullback that touches 20 sma
Place a buy stop above the high of the candle that touched the 20 sma
Stop Loss below the 20 sma
Take Profit up to you
TP can be price crossing below 20 sma
TP can be a 1 x 2 risk reward ratio
TP could be a fib level

