Nifty Auto Index – Breakout Watch with Bullish MomentumNifty Auto Index—Breakout Watch with Bullish Momentum
Timeframe: Daily
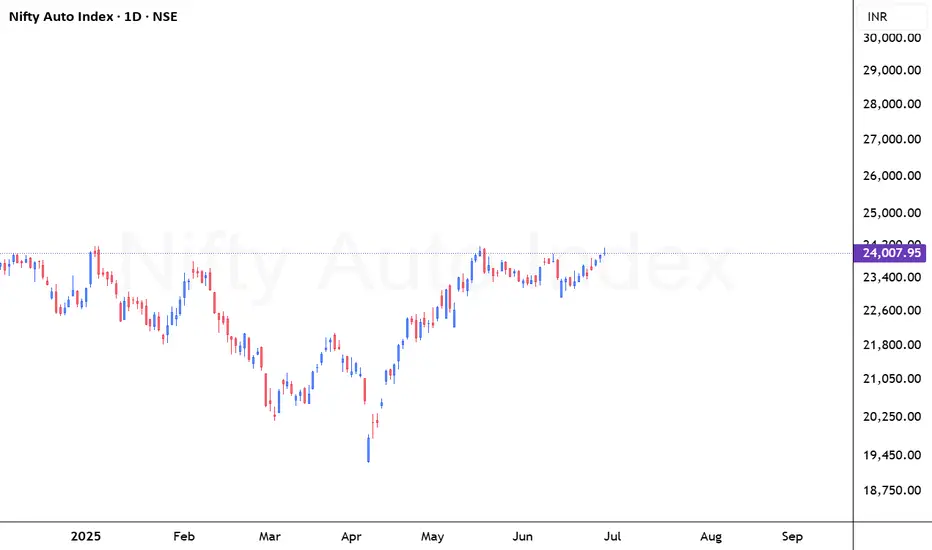
Current Price: ₹24,007.95
Trend: Consolidation Breakout / Bullish Setup
🔍 Technical Highlights:
Consolidation Zone: Price has remained in a tight sideways range for the past 5 weeks (~₹23,000–₹24,000), indicating accumulation.
Breakout Attempt: Price is currently testing the upper band of this consolidation box (as seen in the green highlighted zone).
Support Zone: Strong support from both PEMA Bands and Developing Weekly/Monthly CPR (₹23,670–₹23,837).
📌 Trade Idea:
Trade Type: Positional Swing Long
Entry: On daily close above ₹24,050 with volume confirmation
Targets:
T1: ₹24,345
T2: ₹25,343
Stop Loss: ₹23,670 (below Monthly CPR and PEMA support)
⚠️ Risk Management Notes:
Risk-to-reward is favorable if entered near breakout with SL below the CPR zone.
Monitor for any rejection at weekly/monthly H3 zones for partial booking.
Avoid fresh longs if the index fails to hold above ₹24,000 by the end of the week.
The Nifty Auto Index shows strong signs of bullish momentum as it attempts to break out of a 5-week range, supported by PEMA and Camarilla levels. A close above ₹24,050 may initiate a new swing leg toward ₹25,000+.
CNXAUTO trade ideas
HUGE POTENTIAL IN THE NIFTY AUTO INDEX - STARTING OF THE 5 WAVEIndian Auto Index Technical Analysis
The Indian Auto Index made an all-time high (ATH) of approximately 27,700, completing Wave 3
From there, a Wave 4 corrective phase began, ending at 19,300 (a 30% decline).
A large Flag pattern has formed on the monthly charts and has been broken with a strong bullish candle, projecting a full target of 38,000 (an upside of 63%).
Using the Fibonacci extension from the COVID fall, the 3.618 level comes to approximately 32,600.
Taking the extension of Waves 3 and 4, the 1.618 level also points to 32,600, reinforcing this level as a major target.
List of Technical Targets
Target 1 – 23,960
Target 2 – 25,500
Target 3 – 27,700 (previous ATH)
Target 4 – 32,600 (Fibonacci confluence)
Target 5 – 34,000
Target 6 – 38,000 (flag pattern breakout target)
Important Dates Based on Time Cycle Analysis
17 November 2025
30 March 2026
4 January 2027
29 April 2029

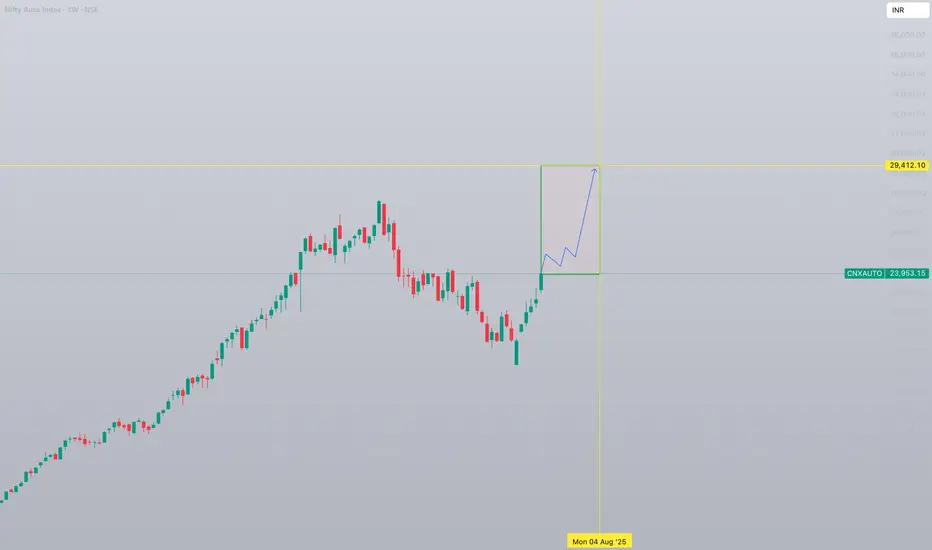
Nifty Auto Index 1W forecast until August 2025NSE Auto Index is in "discharge" mode. This will last until the level of 25000 followed by a sideways-cooldown movement.
Bullish structure will stay intact and the second bullrun will happen shortly.
Major correction/retest will happen after the breakout of previous all-time-high and setting a new ATH with a top at 29,500 in the beginning of August 2025.
nse auto movement on mondayThe NSE Auto Index (NIFTY Auto) is currently showing some interesting movements. As of the latest data, it appears that the index is in a slight downtrend1. The index is trading below an important level of 23,543.16, and if it remains below this level, it might continue to show a downward movement in the short term.
However, predicting exact movements can be tricky as they depend on various factors including market sentiment, economic indicators, and company-specific news. It's always good to keep an eye on the latest developments and perhaps consult with a financial advisor before making any decisions.
Would you like to know more about how to analyze such trends or any other specific information?

Nifty Auto SellNifty Auto elliot wave analysis count 2020 . Current time elliot wave 4 downside correction .

Finally - Nifty Auto chartThis is why I am bullish on nifty, keep in radar auto stocks for swing.
#Maruti
#M&M
#Escorts
#Tatamotors

Nifty Auto might gain more than 30 % in 3 to 4 monthsNifty Auto might gain more than 30 % , Please find my technical analysis in the chart

Auto move to South?can see a RSI divergence in the chart, we may witness some downfall in coming days before it can go forward.

Nifty Auto !!! Almost der for sellingHello All,
The recommendations are purely for educational purpose only, consult you financial advisor before trading.
Targets are mentioned in charts (either red lines or balck lines), keep Stop Loss as per your risk..
If you like my Idea, Don't forget to Boost and comment on my Analysis..
Have a profitable year ahead
Gautam Khanna
Technical Analyst by Passion :-)


Nifty Auto index cautiousmoving averges
below 20 EMA
Daily RSI below 60
support 17023 as 50 EMA
major support 16652

Decoding the Mystery Behind Dec 20 Fall - Part 77. Nifty Auto -2.28%
3 Months - Rounding Bottom BO done. Target 19752 - nothing wrong in 3 Months / Monthly scale - its going up and wick is getting formed once in a while
Weekly - as you can see at every step - there is a Horizontal Consolidation (BOX Pattern) for some weeks then BO, again BOX BO and repeat.....
When the stock / sector has a crossed ATH and goes up - there is no more resistance it push it down. But it writes its own fate by creating new Support & Resistances once again because of People's Greed & Fear. When majority thinks it has grown too much - they sell off causing a temp dip.
As you can see - there are bigger Red candles in Weekly history. Absolutely nothing wrong - and Still in the Bullish pattern - no negation of pattern anywhere. Trendline Support is also an additional support

RSI Multi-time frame Green Color if M & W Abv 60 and D Abv 40This indicator displays RSI in Day, Weekly and Month
Multi time frame momentums in one display..
In addition set to display RSI in color if Monthly & Weekly above 60 and Daily above 40.
Best used with Volume Indicator for detecting reversal at 40 RSI

AUTOAuto index need to hold the support level, we will have to see how the market reacts to the all the auto earnings numbers over the weekend. Coming festive season is a exciting sign for auto index. we shall see if it holds up or breaks below.

NIFTY AUTONifty auto trading in a channel and reached the upper end of the channel in monthly timeframe. EXPECTING A BO in the structure bt beware of trapping if happens onn upper levels. Bais is CAUTIOUSLY BULLISH at current levels.

History repeats itselfCNXAUTO having similar chart structure, it may correct upto 50%, from the recent swing low, so please avoid long and if any opportunity in smaller time frame, we can have short in auto stocks
During this fall, it will take a pull back, time your entry and make 💰💰

NIFTY AUTOAfter consolidation, it is on way to break upper end of the channel line. Stocks from this sector may be kept in radar for coming week.

NIFTY AUTOJust tighten you SL if your are having positions in Auto stocks. It seems that there may be some underperformance in coming days from this sector.

Nifty auto cnxauto aka nifty auto given an all time breakout of a long term upper trendline sector and all the components of the mentioned stocks is also following the same trend of the index one can add auto stocks on dips this sector can be leading sector soon

NIFTYAUTOLong base has been formed in ratio chart any breakout this base will give good upside in auto stocks. Hence, keep auto stocks in radar and also this chart. If breakout is not happening then don't go long there

are we looking for a 5th wave impulse!NSE:CNXAUTO
are we unfolding an impulse on upside!
time to prove the wave structure!
NSE:NIFTY

Don't miss this "HISTORIC BREAKOUT" in NIFTY AUTO!!!! There is a clear BREAKOUT on the WEEKLY CHARTS!!!!!!!!
See the Comparative chart analysis, TVS Motor, M&M, Eicher Motor and TATA Motor are more likely to outperform the AUTO INDEX!!!!!!!!!
This seems to be the footprint of a future rally in auto stocks. And there is a large possibility that TVS Motor, M&M, Eicher Motor and TATA Motor will lead this rally and continually outperform the INDEX.
If you want regular updates on - which auto stock to buy? And To know more potential BREAKOUTS, please FOLLOW and LIKE!!!!!!

NIFTYAUTO Consolidation Nr. Resistance Breakout Potential?🚗 #NIFTYAUTO is currently trading in a consolidation zone, with the price hovering near the upper boundary. This level has proven to be a tough resistance for the price in the past, with the range of 13455--13544 being a major obstacle to overcome.
📈 However, if the price manages to break out of this resistance area and closes above it on the weekly chart, we could potentially see a strong upward momentum in the near future. This is especially significant considering the prolonged period of consolidation that the price has been experiencing.
📉 On the other hand, if the price fails to break through the resistance zone, we may see it retreat back into the consolidation phase once again.
🔍 Traders should keep a close eye on #NIFTYAUTO and monitor its movement around the key resistance level. A successful breakout could present lucrative trading opportunities, while a failure to do so may indicate a continued period of consolidation. Happy trading!
