NiftyAuto Avoid new LongsNifty Auto appears to be at bad Risk/Reward ratio.
Relative Momentum Indicator is pointing to temporary peak.
Better to avoid fresh Longs.
Since there are sectors which are doing well, I would concentrate on them rather than trying to find short trades in Auto. Especially when the Nifty is looking bullish.
CNXAUTO trade ideas

CNXAUTO - Weekly AnalysisIn the Weekly Chart of CNXAUTO ( Nifty AUTO ),
we can see that, It gave a bounce back from Breakout Range Zone.
Let it Auto Shares retest for 1 or 2 Week.

How to Spot next leader ? Auto sector NSE:CNXAUTO
Relative strength compared to Nifty 50 - NIFT Auto clear outperformer since Jan 2023. Remember Nifty 50 is on downtrend while Auto is on uptrend.
Now look for stocks which have better chart pattern than NIFTY Auto.
These are going to perform better once NIFTY 50 turn positive. Some examples.
1) NSE:M_M
2) NSE:MAHINDCIE
3) NSE:APOLLOTYRE

Index and Stock OutperformedNIFTY FMCG and NIFT AUTO outperformed last week
Stocks: ITC - BRITANNIA - M&M - NDR AUTO COMPONANTS - AUTOMOTIVE AXLES

NIFTY --AUTOPRICE MOMENT FOR THE WEEK .DOUBLE TOP ON WEEKELY TIME FRAME
DISCLAIMER: This is my own analysis and you do your own analysis before you take any trade and I am not SEBI registered and contact your financial adviser before taking any trades .I am not responsible for your profit or loss. This is only for educational purpose and learning.

Nifty Auto still in bull phaseTill the time nifty auto index is above the support zone highlighted in red, it is in bull phase....
I had UTI transport fund as a basket approach. UTI transport fund is replica of auto index...

CNX AUTO Completing its journey??CNX AUTO HAD AN EXTENDED WAVE 3.BY RULE OF ALTERNATION,Amplitude of 5 and structure has to be like 1.1 Terminated in a complex correction .Wave 5 seems to be doing it


Star of the week Chart. CNX Auto IndexThis is the most interesting chart of this week. This is a weekly chart of Nifty Auto Index (CNX AUTO). In Dec 17, Auto index made its all time high around 12000 and since then the stock is consolidating below that level. Even in recent times the index tested its resistance, however, this week the index is able to give a clear breakout. This will provide a very good medium term money earning opportunity in auto stocks. Since 2 weeks I have already recommended Hero Motor, Lumax, Jamna etc. the analysis of which can be read for targets and stop losses. Even in future, as and when I get more stocks I will keep recommending it. If we calculate Fibonacci in recent consolidation, we are getting a very aggressive targets and I wish everyone following me should make a great money in months.
CMP - 12361 (16/7/22)
T - 13500, 16000, 18500, 20000 W
SL - 11850 W
View - Medium to Long term.

Be watchful of Auto Stocks!This is a weekly chart of Nifty Auto index (CNX Auto) . Since Dec 17 , the stock is facing a serious resistance around 12000 . It has taken a multiple resistance in near past. However, the index is again trying to test its resistance. Close above 12000 levels would mean a fresh breakout on medium to long term charts. Keep in watch Ashok Layland, Maruti Suzuki, Tata Moters, M&M, Eicher moters. Go long in these industry leaders if you see 12000+ weekly closing.

NIFTY AUTO NIFTY AUTO - Doji formation at major supply zone
This shows high level of indecisiveness in Auto stocks by both bears and bulls.
A breakout above 12052 levels will prove to be a bullish case.

NIFTY AUTO Trend AnalysisWorst scenario for those who are bullish thinking of potential Cup with Handle pattern formation on a broader outlook or reverse Head & Shoulder pattern on a narrower outlook.
If you look carefully, you can see the descending broadening wedge clearly as highlighted in my chart.
You can zoom out to see the broader view of my chart with all the drawings.
Technically this chart looks almost similar to the Ashok Leyland chart I have posted earlier this month.
TDI is at upper band with NIFTY AUTO nearing the resistance zone in confluence with the edge of pitchfork and upper edge of the descending broadening wedge highlighted.
Moreover a strong hidden bearish divergence in MACD histogram is observed on weekly timeframe. (Not applied here because chart is on daily timeframe).
Expecting a fall of approximately 30-33% towards 7700-8000 level, which is next possible support zone lying near golden Fib level.
The fundamental attributes of major auto companies are not looking good specially with the declining OPM% (At lowest levels).
It's better to avoid FOMO in auto sector stocks because of all good news and invest after this big correction or else keep averaging.
Do your own due diligence before taking any action.
Peace!!

Perfect example of a choppy market (consolidation)Market's do not trend all the time. After a strong trend in either direction, the market goes into consolidation mode where it chops between a range for weeks to months trapping both sides.
It is best to sit on the sidelines as getting the direction right in such a situation doesn't provide the best risk:reward

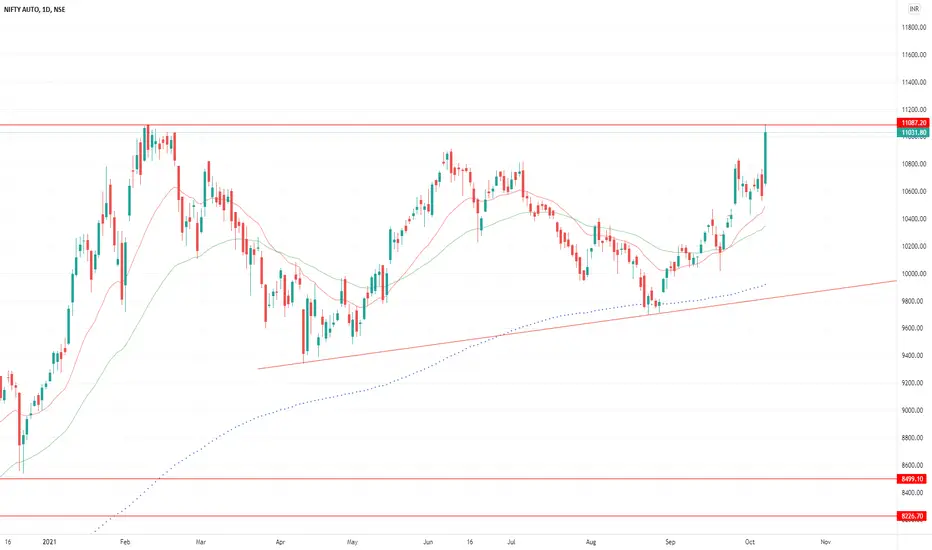
Nifty AutoImportant levels in nifty Auto
Tata motors and other auto segment companies will boom in some months. But the time is now to get in the auto segment.i can say one month of time duration to enter in it.


CNXAUTO (AUTO INDEX-NSE) Analysis For December 08, 2021CNXAUTO (AUTO INDEX-NSE) has crossed 50% Fibo Level and closed above 10750. One can enter a fresh buy above 10790 important resistences are 10830 & 10925. For entering a fresh sell trade wait for 50% Fibo Level - 10750 and important supports are 10700 & 10670.
Reach us on TradingView to get Free Access to our Indicators!
Find BOBALGO on Tradingview.com
Whatsapp - 91 96240 44866


Nifty auto seems bullishnifty auto made w (double bottom) pattern on a strong support on daily timeframe and gone bullish retraced a little bit took support and ready to go!! It comes near previous high, if it breaks that level then good fot us

NiftyAutoNiftyAuto trend approaching multiyear resistance and if this breaks we may see good rally in auto sector stocks

NiftyAutoNifty Auto sector approaching multiyear resistance ..if it breaks we may see good rally in auto sector stocks

trianglekeep eyes on Auto stocks . stocks are showing strenth . as we have seen tatamotors ,maruti and ashoklyland ,bharatforge all are forming kind of PA patterns and ready to fly. keep eyes on tyre companies and batteries also . sector may do well in upcoming sessions as well stocks.
channel broken in nifty autovery long going channel broken inn nifty auto, the RS is also positive, plus in the long term auto sector is strong
