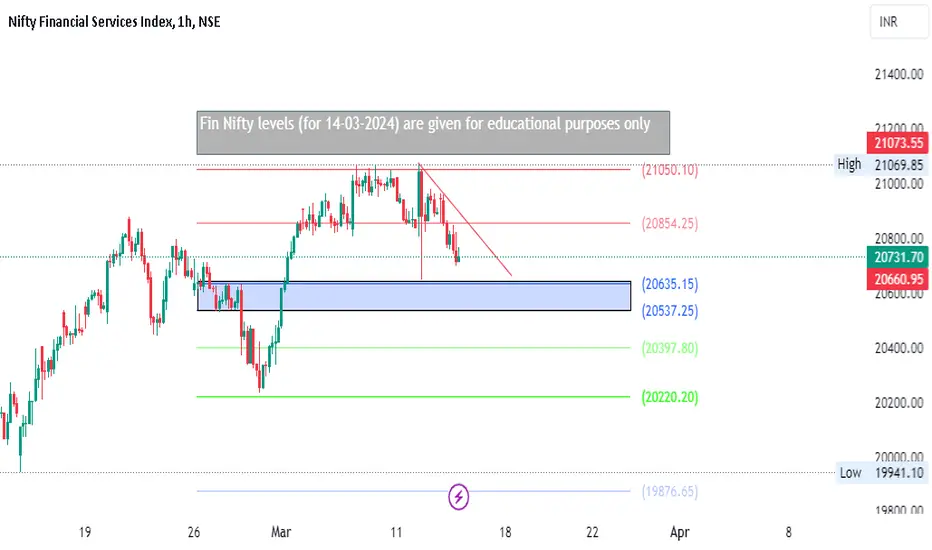
Fin Nifty levels (for 14-03-2024) Fin Nifty levels (for 14-03-2024) are given for educational purposes only
CNXFINANCE trade ideas
FIN NIFTY S/R for 13/2/24Support and Resistance Levels: In technical analysis, support and resistance levels are significant price levels where buying or selling interest tends to be strong. They are identified based on previous price levels where the price has shown a tendency to reverse or find support.
Support levels are represented by the green line and green shade, indicating areas where buying interest may emerge to prevent further price decline.
Resistance levels are represented by the red line and red shade, indicating areas where selling pressure may arise to prevent further price increases. Traders often consider these levels as potential buying or selling opportunities.
Breakouts: Breakouts occur when the price convincingly moves above a resistance level (red shade) or below a support level (green shade). A bullish breakout above resistance suggests the potential for further price increases, while a bearish breakout below support suggests the potential for further price declines. Traders pay attention to these breakout signals as they may indicate the start of a new trend or significant price movement.
Keltner Channel: The Keltner Channel is a technical indicator that uses an exponential moving average (EMA) and an average true range (ATR) to create an upper and lower channel around the price action. The upper line of the channel represents the upper limit of the average range, and the lower line represents the lower limit. Traders can use the Keltner Channel to identify potential long and short positions.
Long Position: A long position may be considered when the price is trading above the upper line of the Keltner Channel. This suggests that the price is trading above the average range and may continue in an upward trend, potentially offering buying opportunities.
Short Position: A short position may be considered when the price is trading below the lower line of the Keltner Channel. This suggests that the price is trading below the average range and may continue in a downward trend, potentially offering selling opportunities.
Disclosure: I am not SEBI registered. The information provided here is for learning purposes only and should not be interpreted as financial advice. It is important to consult with a qualified financial advisor before making any investment decisions. Tweets neither advice nor endorsement.

Fin Nifty levels (for 13-03-2024)Fin Nifty levels (for 13-03-2024) are given for educational purposes only

Fin Nifty levels (for 12-03-2024)Fin Nifty levels (for 12-03-2024) are given for learning purposes only

All INDEX key levels for March 12, 2024 #Nifty #BankNifty Stay ahead of the curve with our daily Bank Nifty key levels!
All INDEX key levels for March 12, 2024
Overview:
Today's trading session presented significant opportunities within the Bank Nifty index and we executed the trades based on the levels published yesterday on tradingview and we were able to capture the fall of 300 points in BankNifty
Here are the key levels to watch for potential entry and exit points in NSE:BANKNIFTY
Resistance Levels:
- Refer the Red line on the chart
Support Levels:
- Refer the Green line on the chart
Trading Strategy:
- Long Position:
Consider initiating long positions near support levels only after reversal confirmation for potential upside movement.
- Short Position:
Consider initiating short positions near resistance levels only after reversal confirmation for potential downside movement.
Risk Management:
- Always use stop-loss orders to protect against adverse market movements.
- Consider position sizing based on risk tolerance and account equity.
Disclaimer:
These levels are provided for informational purposes only and should not be considered as financial advice. Trading involves risk, and past performance is not indicative of future results. Always conduct your own research and consult with a qualified financial advisor before making any investment decisions.
Thanks


Important level for next weekMiddle level Important for 12.3.24 and up side and down side important for week


FIN NIFTY S/R for 12/3/24Support and Resistance Levels: In technical analysis, support and resistance levels are significant price levels where buying or selling interest tends to be strong. They are identified based on previous price levels where the price has shown a tendency to reverse or find support.
Support levels are represented by the green line and green shade, indicating areas where buying interest may emerge to prevent further price decline.
Resistance levels are represented by the red line and red shade, indicating areas where selling pressure may arise to prevent further price increases. Traders often consider these levels as potential buying or selling opportunities.
Breakouts: Breakouts occur when the price convincingly moves above a resistance level (red shade) or below a support level (green shade). A bullish breakout above resistance suggests the potential for further price increases, while a bearish breakout below support suggests the potential for further price declines. Traders pay attention to these breakout signals as they may indicate the start of a new trend or significant price movement.
Keltner Channel: The Keltner Channel is a technical indicator that uses an exponential moving average (EMA) and an average true range (ATR) to create an upper and lower channel around the price action. The upper line of the channel represents the upper limit of the average range, and the lower line represents the lower limit. Traders can use the Keltner Channel to identify potential long and short positions.
Long Position: A long position may be considered when the price is trading above the upper line of the Keltner Channel. This suggests that the price is trading above the average range and may continue in an upward trend, potentially offering buying opportunities.
Short Position: A short position may be considered when the price is trading below the lower line of the Keltner Channel. This suggests that the price is trading below the average range and may continue in a downward trend, potentially offering selling opportunities.
Disclosure: I am not SEBI registered. The information provided here is for learning purposes only and should not be interpreted as financial advice. It is important to consult with a qualified financial advisor before making any investment decisions. Tweets neither advice nor endorsement.

Fin Nifty levels (for 08-03-2024) Fin Nifty levels (for 08-03-2024) are given for learning purposes only

FINNIFTY- Intraday Levels - 11th March 2024* Approx movement expect is around +/- 90
If FINNIFTY Sustain above 21038 to 21063 then 21092 to 21126 above this bullish.
if FINNIFTY Sustain Below 20969 then 20866 to 20841 then 20802 to 20769 below this more bearish.
Consider some buffer points in above levels.
Please do your due diligence before trading or investment.
**Disclaimer -
I am not a SEBI registered analyst or advisor. I does not represent or endorse the accuracy or reliability of any information, conversation, or content. Stock trading is inherently risky and the users agree to assume complete and full responsibility for the outcomes of all trading decisions that they make, including but not limited to loss of capital. None of these communications should be construed as an offer to buy or sell securities, nor advice to do so. The users understands and acknowledges that there is a very high risk involved in trading securities. By using this information, the user agrees that use of this information is entirely at their own risk.
Thank you.


FIN NIFTY S/R for 11/3/24Support and Resistance Levels: In technical analysis, support and resistance levels are significant price levels where buying or selling interest tends to be strong. They are identified based on previous price levels where the price has shown a tendency to reverse or find support.
Support levels are represented by the green line and green shade, indicating areas where buying interest may emerge to prevent further price decline.
Resistance levels are represented by the red line and red shade, indicating areas where selling pressure may arise to prevent further price increases. Traders often consider these levels as potential buying or selling opportunities.
Breakouts: Breakouts occur when the price convincingly moves above a resistance level (red shade) or below a support level (green shade). A bullish breakout above resistance suggests the potential for further price increases, while a bearish breakout below support suggests the potential for further price declines. Traders pay attention to these breakout signals as they may indicate the start of a new trend or significant price movement.
Keltner Channel: The Keltner Channel is a technical indicator that uses an exponential moving average (EMA) and an average true range (ATR) to create an upper and lower channel around the price action. The upper line of the channel represents the upper limit of the average range, and the lower line represents the lower limit. Traders can use the Keltner Channel to identify potential long and short positions.
Long Position: A long position may be considered when the price is trading above the upper line of the Keltner Channel. This suggests that the price is trading above the average range and may continue in an upward trend, potentially offering buying opportunities.
Short Position: A short position may be considered when the price is trading below the lower line of the Keltner Channel. This suggests that the price is trading below the average range and may continue in a downward trend, potentially offering selling opportunities.
Disclosure: I am not SEBI registered. The information provided here is for learning purposes only and should not be interpreted as financial advice. It is important to consult with a qualified financial advisor before making any investment decisions. Tweets neither advice nor endorsement.

FIN NIFTY S/R for 7/3/24Support and Resistance Levels: In technical analysis, support and resistance levels are significant price levels where buying or selling interest tends to be strong. They are identified based on previous price levels where the price has shown a tendency to reverse or find support.
Support levels are represented by the green line and green shade, indicating areas where buying interest may emerge to prevent further price decline.
Resistance levels are represented by the red line and red shade, indicating areas where selling pressure may arise to prevent further price increases. Traders often consider these levels as potential buying or selling opportunities.
Breakouts: Breakouts occur when the price convincingly moves above a resistance level (red shade) or below a support level (green shade). A bullish breakout above resistance suggests the potential for further price increases, while a bearish breakout below support suggests the potential for further price declines. Traders pay attention to these breakout signals as they may indicate the start of a new trend or significant price movement.
Keltner Channel: The Keltner Channel is a technical indicator that uses an exponential moving average (EMA) and an average true range (ATR) to create an upper and lower channel around the price action. The upper line of the channel represents the upper limit of the average range, and the lower line represents the lower limit. Traders can use the Keltner Channel to identify potential long and short positions.
Long Position: A long position may be considered when the price is trading above the upper line of the Keltner Channel. This suggests that the price is trading above the average range and may continue in an upward trend, potentially offering buying opportunities.
Short Position: A short position may be considered when the price is trading below the lower line of the Keltner Channel. This suggests that the price is trading below the average range and may continue in a downward trend, potentially offering selling opportunities.
Disclosure: I am not SEBI registered. The information provided here is for learning purposes only and should not be interpreted as financial advice. It is important to consult with a qualified financial advisor before making any investment decisions. Tweets neither advice nor endorsement.

FIN NIFTY S/R for 6/3/24Support and Resistance Levels: In technical analysis, support and resistance levels are significant price levels where buying or selling interest tends to be strong. They are identified based on previous price levels where the price has shown a tendency to reverse or find support.
Support levels are represented by the green line and green shade, indicating areas where buying interest may emerge to prevent further price decline.
Resistance levels are represented by the red line and red shade, indicating areas where selling pressure may arise to prevent further price increases. Traders often consider these levels as potential buying or selling opportunities.
Breakouts: Breakouts occur when the price convincingly moves above a resistance level (red shade) or below a support level (green shade). A bullish breakout above resistance suggests the potential for further price increases, while a bearish breakout below support suggests the potential for further price declines. Traders pay attention to these breakout signals as they may indicate the start of a new trend or significant price movement.
Keltner Channel: The Keltner Channel is a technical indicator that uses an exponential moving average (EMA) and an average true range (ATR) to create an upper and lower channel around the price action. The upper line of the channel represents the upper limit of the average range, and the lower line represents the lower limit. Traders can use the Keltner Channel to identify potential long and short positions.
Long Position: A long position may be considered when the price is trading above the upper line of the Keltner Channel. This suggests that the price is trading above the average range and may continue in an upward trend, potentially offering buying opportunities.
Short Position: A short position may be considered when the price is trading below the lower line of the Keltner Channel. This suggests that the price is trading below the average range and may continue in a downward trend, potentially offering selling opportunities.
Disclosure: I am not SEBI registered. The information provided here is for learning purposes only and should not be interpreted as financial advice. It is important to consult with a qualified financial advisor before making any investment decisions. Tweets neither advice nor endorsement.

Fin Nifty levels for (06-03-2024)Fin Nifty levels for (06-03-2024) are given for learning purposes only

Fin Nifty levels (for 05-03-2024)Fin Nifty levels (for 05-03-2024) are given for educational purposes only

Topping Formations all around!Almost all indices in this layout are showing triangular topping formations.
Ending Diagonals in Nifty 50, Nifty 500, Nifty Midcap 100, Nifty IT.
B Wave triangles in Nifty Small Cap 100, Bank Nifty, Fin Nifty index.
Nifty IT has already broken down of the pattern. Let's see how other charts follow up.

FINNIFTY- Intraday Levels - 5th March 2024* Approx movement expect is around +/- 100 or 330
If FINNIFTY if Sustain above 21038 strong level then around 21166 to 21200 Strong level then then 21234 to 21240
if FINNIFTY if Sustain Below 20799 Strong level then 20645 to 20606 below this more bearish.
Consider some buffer points in above levels.
Please do your due diligence before trading or investment.
**Disclaimer -
I am not a SEBI registered analyst or advisor. I does not represent or endorse the accuracy or reliability of any information, conversation, or content. Stock trading is inherently risky and the users agree to assume complete and full responsibility for the outcomes of all trading decisions that they make, including but not limited to loss of capital. None of these communications should be construed as an offer to buy or sell securities, nor advice to do so. The users understands and acknowledges that there is a very high risk involved in trading securities. By using this information, the user agrees that use of this information is entirely at their own risk.
Thank you.

FIN NIFTY S/R for 5/3/24Support and Resistance Levels:
Based on the price action, you have to identify two significant levels: the red line acting as resistance and the green line acting as support. Additionally, there have marked red and green shades to represent resistance and support zones, respectively.
Support: The green line and green shade represent support levels. These levels are where the price tends to find buying interest, preventing it from falling further. Traders can consider these levels as potential buying opportunities.
Resistance: The red line and red shade represent resistance levels. These levels are where the price tends to encounter selling pressure, preventing it from rising further. Traders can consider these levels as potential selling opportunities.
Breakouts: If the price breaks above the resistance zone (red shade) convincingly, it may indicate a bullish breakout, and the price could move higher to the next resistance level. On the other hand, if the price breaks below the support zone (green shade) convincingly, it may indicate a bearish breakout, and the price could move lower to the next support level.
Keltner Channel:
The Keltner Channel is a technical indicator that uses an exponential moving average (EMA) to create an upper and lower channel around the price action. Traders can use this channel to identify potential long and short positions.
Long Position: If the price is above the upper line of the Keltner Channel, it may indicate a potential long opportunity, as it suggests the price is trading above the average range and might continue in an upward trend.
Short Position: If the price is below the lower line of the Keltner Channel, it may indicate a potential short opportunity, as it suggests the price is trading below the average range and might continue in a downward trend.
Disclosure: I am not SEBI registered. I just wanted to let you know that the information provided here is for learning purposes only. Please consult your financial advisor before making any decisions. Tweets neither advice nor endorsement.

Fin Nifty levels (for 04-03-2024) Fin Nifty levels (for 04-03-2024) are given for educational purposes only

FINNIFTY- Intraday Levels - 4th March 2024* Approx movement expect is around +/- 200 or 320
If FINNIFTY Sustain above 20875 then 21031 to 21038 then 21151 to 21166 then 21234 above this more bullish
if FINNIFTY Sustain Below 20827 then 20645 to 20623 then 20519 to 20504 then 20449 to 20420 below this more bearish.
Consider some buffer points in above levels.
Please do your due diligence before trading or investment.
**Disclaimer -
I am not a SEBI registered analyst or advisor. I does not represent or endorse the accuracy or reliability of any information, conversation, or content. Stock trading is inherently risky and the users agree to assume complete and full responsibility for the outcomes of all trading decisions that they make, including but not limited to loss of capital. None of these communications should be construed as an offer to buy or sell securities, nor advice to do so. The users understands and acknowledges that there is a very high risk involved in trading securities. By using this information, the user agrees that use of this information is entirely at their own risk.
Thank you.

FINNIFTY- Intraday Levels - 27th Feb 2024* Approx movement expect is around +/- 250
If FINNIFTY if Sustain above 20634 or 20645 then 20665 then 20724 to 20752 then 20836 to 20861
if FINNIFTY if Sustain Below 20585 then 20548 then 20518 then 20518 Strong level then 20465 strong level then 20430 then 20405 then 20373
Consider some buffer points in above levels.
Please do your due diligence before trading or investment.
**Disclaimer -
I am not a SEBI registered analyst or advisor. I does not represent or endorse the accuracy or reliability of any information, conversation, or content. Stock trading is inherently risky and the users agree to assume complete and full responsibility for the outcomes of all trading decisions that they make, including but not limited to loss of capital. None of these communications should be construed as an offer to buy or sell securities, nor advice to do so. The users understands and acknowledges that there is a very high risk involved in trading securities. By using this information, the user agrees that use of this information is entirely at their own risk.
Thank you.
