CNXFINANCE, FINNIFTY Analysis For Feb 19th!Hello Traders,
Here is a Brief Overview About The Analysis of FINNIFTY For Feb 19th,
There Are Total of 2 Support Zones Which You Need To Look For And Same 3 Resistance Zones And To Be Mentioned One Grey Area And We Have 4 Imbalance Zones!
The Horizontal Lines From Volume To Volume And OI To OI Indicates The Market Range in Between For That Particular Day!
The Blue Arrow Path Showing The Direction of The FINNIFTY For Tomorrow.
Note : Those Levels Are Only For That Particular Day.
Please Note That The Only Purpose of The Information On This Page is Purely Educational.
We Are Not Registered with SEBI; Therefore, Before Making Any Financial Decisions OR Investing, Please Consult with A SEBI-Qualified Financial Advisor. We Don't Have Any Responsibility For Your Profits OR Losses.
I Would Welcome Your Participation And Support in the Form of Likes, Comments, And Follow us to Offer Some Encouragement.
Thank You.
CNXFINANCE trade ideas

Fin Nifty levels (for 19-02-2024)Fin Nifty levels (for 19-02-2024) are given for learning purposes only

FIN NIFTY S/R for 19/2/24Support and Resistance Levels:
Based on the price action, you have to identify two significant levels: the red line acting as resistance and the green line acting as support. Additionally, there have marked red and green shades to represent resistance and support zones, respectively.
Support: The green line and green shade represent support levels. These levels are where the price tends to find buying interest, preventing it from falling further. Traders can consider these levels as potential buying opportunities.
Resistance: The red line and red shade represent resistance levels. These levels are where the price tends to encounter selling pressure, preventing it from rising further. Traders can consider these levels as potential selling opportunities.
Breakouts: If the price breaks above the resistance zone (red shade) convincingly, it may indicate a bullish breakout, and the price could move higher to the next resistance level. On the other hand, if the price breaks below the support zone (green shade) convincingly, it may indicate a bearish breakout, and the price could move lower to the next support level.
Keltner Channel:
The Keltner Channel is a technical indicator that uses an exponential moving average (EMA) to create an upper and lower channel around the price action. Traders can use this channel to identify potential long and short positions.
Long Position: If the price is above the upper line of the Keltner Channel, it may indicate a potential long opportunity, as it suggests the price is trading above the average range and might continue in an upward trend.
Short Position: If the price is below the lower line of the Keltner Channel, it may indicate a potential short opportunity, as it suggests the price is trading below the average range and might continue in a downward trend.
Disclosure: I am not SEBI registered. I just wanted to let you know that the information provided here is for learning purposes only. Please consult your financial advisor before making any decisions. Tweets neither advice nor endorsement.

CNXFINANCE AnalysisFIN NIFTY::
double bottom is observed.
consider trading in a channel...
we have a chance of inverse head and Shoulders pattern.
now trading at resistance zone.wait for the price to retracement to form right shoulder.
Look for buy at right shoulder..
if price breaks the neckline we have a resistance at 20800 levels.
If neckline acts as support will have a chance of ATH to TEST Again.
By keeping the Stop loss at Right Shoulder will go for long entry.
Note::
If price failed to form the right shoulder, liquidity will be finished below 19800 levels.
then we have a chance of fall back below 19800 levels, by observing consolidation at support levels.
keep safe here.
soo consider this is the crucial levels for continuation or reversal.

CNXFINANCE, FINNIFTY Analysis For Feb 16th!Hello Traders,
Here is a Brief Overview About The Analysis of FINNIFTY For Feb 16th,
There Are Total of 2 Support Zones Which You Need To Look For And Same 2 Resistance Zones And To Be Mentioned One Grey Area And We Have Imbalance Zones in Between The Resistance Zones That Price Could Go.
The Horizontal Lines From Volume To Volume And OI To OI Indicates The Market Range in Between For That Particular Day!
The Blue Arrow Path Showing The Direction of The FINNIFTY For Tomorrow.
Note : Those Levels Are Only For That Particular Day.
Please Note That The Only Purpose of The Information On This Page is Purely Educational.
We Are Not Registered with SEBI; Therefore, Before Making Any Financial Decisions OR Investing, Please Consult with A SEBI-Qualified Financial Advisor. We Don't Have Any Responsibility For Your Profits OR Losses.
I Would Welcome Your Participation And Support in the Form of Likes, Comments, And Follow us to Offer Some Encouragement.
Thank You.

Fin nifty levels for (16-02-2024) Fin nifty levels for (16-02-2024) are given for learning purposes only

FIN NIFTY S/R for 16/2/24Support and Resistance Levels:
Based on the price action, you have to identify two significant levels: the red line acting as resistance and the green line acting as support. Additionally, there have marked red and green shades to represent resistance and support zones, respectively.
Support: The green line and green shade represent support levels. These levels are where the price tends to find buying interest, preventing it from falling further. Traders can consider these levels as potential buying opportunities.
Resistance: The red line and red shade represent resistance levels. These levels are where the price tends to encounter selling pressure, preventing it from rising further. Traders can consider these levels as potential selling opportunities.
Breakouts: If the price breaks above the resistance zone (red shade) convincingly, it may indicate a bullish breakout, and the price could move higher to the next resistance level. On the other hand, if the price breaks below the support zone (green shade) convincingly, it may indicate a bearish breakout, and the price could move lower to the next support level.
Keltner Channel:
The Keltner Channel is a technical indicator that uses an exponential moving average (EMA) to create an upper and lower channel around the price action. Traders can use this channel to identify potential long and short positions.
Long Position: If the price is above the upper line of the Keltner Channel, it may indicate a potential long opportunity, as it suggests the price is trading above the average range and might continue in an upward trend.
Short Position: If the price is below the lower line of the Keltner Channel, it may indicate a potential short opportunity, as it suggests the price is trading below the average range and might continue in a downward trend.
Disclosure: I am not SEBI registered. I just wanted to let you know that the information provided here is for learning purposes only. Please consult your financial advisor before making any decisions. Tweets neither advice nor endorsement.

CNXFINANCE, FINNIFTY Analysis For Feb 15th!Hii,
Here is a Brief Overview About The Analysis of FINNIFTY For Feb 15th,
There Are Total of 3 Support Zones Which You Need To Look For And Same 3 Resistance Zones
The Lines Which is Marked As Option Chain's Open Interest Levels of Volume And Change in Open Interest.
The Horizontal Lines From Volume To Volume And OI To OI Indicates The Market Range in That Particular Day!
The Grey Arrow Path Showing The Direction of The Finnifty. From The Imbalance Zones The Pullback Expecting And After That The Market Shoots UP!
Please Note That The Only Purpose of The Information On This Page is Purely Educational.
We Are Not Registered with SEBI; Therefore, Before Making Any Financial Decisions OR Investing, Please Consult with A SEBI-Qualified Financial Advisor. We Don't Have Any Responsibility For Your Profits OR Losses.
I Would Welcome Your Participation And Support in the Form of Likes, Comments, And Follow us to Offer Some Encouragement.
Thank You.

FIN NFTY S/R for 15/2/24Support and Resistance Levels:
Based on the price action, you have to identify two significant levels: the red line acting as resistance and the green line acting as support. Additionally, there have marked red and green shades to represent resistance and support zones, respectively.
Support: The green line and green shade represent support levels. These levels are where the price tends to find buying interest, preventing it from falling further. Traders can consider these levels as potential buying opportunities.
Resistance: The red line and red shade represent resistance levels. These levels are where the price tends to encounter selling pressure, preventing it from rising further. Traders can consider these levels as potential selling opportunities.
Breakouts: If the price breaks above the resistance zone (red shade) convincingly, it may indicate a bullish breakout, and the price could move higher to the next resistance level. On the other hand, if the price breaks below the support zone (green shade) convincingly, it may indicate a bearish breakout, and the price could move lower to the next support level.
Keltner Channel:
The Keltner Channel is a technical indicator that uses an exponential moving average (EMA) to create an upper and lower channel around the price action. Traders can use this channel to identify potential long and short positions.
Long Position: If the price is above the upper line of the Keltner Channel, it may indicate a potential long opportunity, as it suggests the price is trading above the average range and might continue in an upward trend.
Short Position: If the price is below the lower line of the Keltner Channel, it may indicate a potential short opportunity, as it suggests the price is trading below the average range and might continue in a downward trend.
Disclosure: I am not SEBI registered. I just wanted to let you know that the information provided here is for learning purposes only. Please consult your financial advisor before making any decisions. Tweets neither advice nor endorsement.

Fin nifty levels for (15-02-2024)Fin nifty levels for (15-02-2024) are given for learning purposes only


Fin nifty levels for (14-02-2024) Fin nifty levels for (14-02-2024) are given for learning purposes only

FIN NIFTY S/R for 14/2/24Support and Resistance Levels:
Based on the price action, you have to identify two significant levels: the red line acting as resistance and the green line acting as support. Additionally, there have marked red and green shades to represent resistance and support zones, respectively.
Support: The green line and green shade represent support levels. These levels are where the price tends to find buying interest, preventing it from falling further. Traders can consider these levels as potential buying opportunities.
Resistance: The red line and red shade represent resistance levels. These levels are where the price tends to encounter selling pressure, preventing it from rising further. Traders can consider these levels as potential selling opportunities.
Breakouts: If the price breaks above the resistance zone (red shade) convincingly, it may indicate a bullish breakout, and the price could move higher to the next resistance level. On the other hand, if the price breaks below the support zone (green shade) convincingly, it may indicate a bearish breakout, and the price could move lower to the next support level.
Keltner Channel:
The Keltner Channel is a technical indicator that uses an exponential moving average (EMA) to create an upper and lower channel around the price action. Traders can use this channel to identify potential long and short positions.
Long Position: If the price is above the upper line of the Keltner Channel, it may indicate a potential long opportunity, as it suggests the price is trading above the average range and might continue in an upward trend.
Short Position: If the price is below the lower line of the Keltner Channel, it may indicate a potential short opportunity, as it suggests the price is trading below the average range and might continue in a downward trend.
Disclosure: I am not SEBI registered. I just wanted to let you know that the information provided here is for learning purposes only. Please consult your financial advisor before making any decisions. Tweets neither advice nor endorsement.

Fin Nifty levels (for 13-02-2024) Fin Nifty levels (for 13-02-2024) are given for educational purposes only

CNXFINNIFTY analysis for 13/02/2024The CNX Financial Nifty (CNXFINNIFTY) is currently navigating a market scenario defined by distinct levels, providing guidance for traders and investors. The range between 20,067 and 19,972 signifies a no trading reversal zone, indicating a period of consolidation or indecision. Traders are advised to exercise caution within this range, awaiting clearer signals or a decisive breakout before making significant trading decisions.
The previous day high and Open Interest (OI) resistance levels are identified between 20,236 and 20,201. This zone represents a challenging area for upward momentum, where the market may encounter resistance. Traders should closely monitor price action and market developments for potential bullish breakthroughs or reversals.
Conversely, the previous day low and OI support levels are positioned between 19,823 and 19,758. This zone acts as a critical support area, where the market may find buying interest. Traders should pay close attention to any signs of a breakdown below this support, as it could signal a bearish shift in sentiment.
For traders holding short positions, the profit booking zone is situated between 19,643 and 19,559. This range represents an area where those who have taken bearish positions may consider securing profits in anticipation of a potential bounce or market reversal.
Successfully navigating these zones requires a careful analysis of market dynamics, incorporating technical indicators, and staying informed about relevant news and economic factors. Traders should adapt their strategies based on evolving market conditions and be prepared to adjust their positions as new information becomes available. Regularly reassessing the trade and considering potential adjustments to stop-loss or take-profit levels is advisable to align with changing market dynamics.
This is for educational purpose only.

FIN NIFTY S/R for 13/2/24Support and Resistance Levels:
Based on the price action, you have to identify two significant levels: the red line acting as resistance and the green line acting as support. Additionally, there have marked red and green shades to represent resistance and support zones, respectively.
Support: The green line and green shade represent support levels. These levels are where the price tends to find buying interest, preventing it from falling further. Traders can consider these levels as potential buying opportunities.
Resistance: The red line and red shade represent resistance levels. These levels are where the price tends to encounter selling pressure, preventing it from rising further. Traders can consider these levels as potential selling opportunities.
Breakouts: If the price breaks above the resistance zone (red shade) convincingly, it may indicate a bullish breakout, and the price could move higher to the next resistance level. On the other hand, if the price breaks below the support zone (green shade) convincingly, it may indicate a bearish breakout, and the price could move lower to the next support level.
Keltner Channel:
The Keltner Channel is a technical indicator that uses an exponential moving average (EMA) to create an upper and lower channel around the price action. Traders can use this channel to identify potential long and short positions.
Long Position: If the price is above the upper line of the Keltner Channel, it may indicate a potential long opportunity, as it suggests the price is trading above the average range and might continue in an upward trend.
Short Position: If the price is below the lower line of the Keltner Channel, it may indicate a potential short opportunity, as it suggests the price is trading below the average range and might continue in a downward trend.
Disclosure: I am not SEBI registered. I just wanted to let you know that the information provided here is for learning purposes only. Please consult your financial advisor before making any decisions. Tweets neither advice nor endorsement.


FIN NIFTY S/R for 12/2/24Support and Resistance Levels:
Based on the price action, you have to identify two significant levels: the red line acting as resistance and the green line acting as support. Additionally, there have marked red and green shades to represent resistance and support zones, respectively.
Support: The green line and green shade represent support levels. These levels are where the price tends to find buying interest, preventing it from falling further. Traders can consider these levels as potential buying opportunities.
Resistance: The red line and red shade represent resistance levels. These levels are where the price tends to encounter selling pressure, preventing it from rising further. Traders can consider these levels as potential selling opportunities.
Breakouts: If the price breaks above the resistance zone (red shade) convincingly, it may indicate a bullish breakout, and the price could move higher to the next resistance level. On the other hand, if the price breaks below the support zone (green shade) convincingly, it may indicate a bearish breakout, and the price could move lower to the next support level.
Keltner Channel:
The Keltner Channel is a technical indicator that uses an exponential moving average (EMA) to create an upper and lower channel around the price action. Traders can use this channel to identify potential long and short positions.
Long Position: If the price is above the upper line of the Keltner Channel, it may indicate a potential long opportunity, as it suggests the price is trading above the average range and might continue in an upward trend.
Short Position: If the price is below the lower line of the Keltner Channel, it may indicate a potential short opportunity, as it suggests the price is trading below the average range and might continue in a downward trend.
Disclosure: I am not SEBI registered. I just wanted to let you know that the information provided here is for learning purposes only. Please consult your financial advisor before making any decisions. Tweets neither advice nor endorsement.

Fin Nifty levels (for 12-02-2024)Fin Nifty levels (for 12-02-2024) are given for educational purposes only

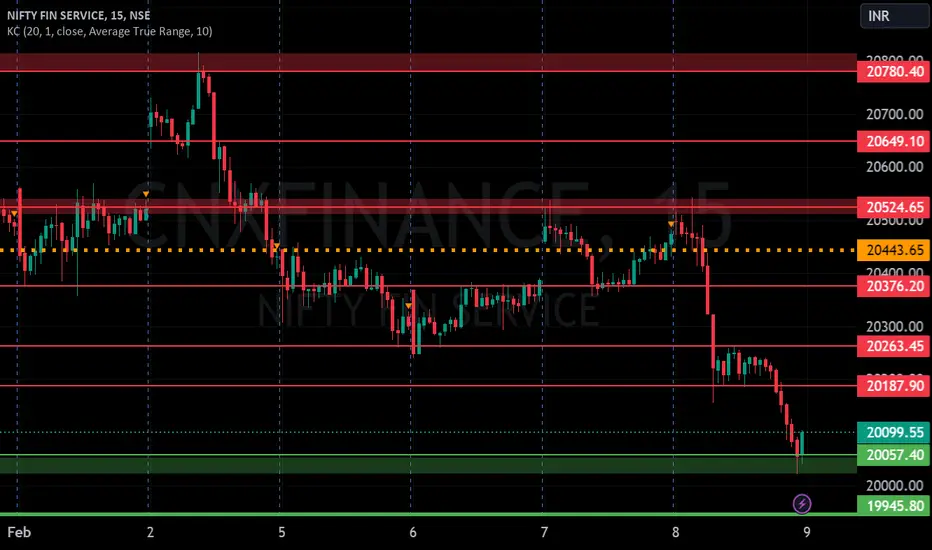
FIN NIFTY S/R for 9/2/24Support and Resistance Levels:
Based on the price action, you have to identify two significant levels: the red line acting as resistance and the green line acting as support. Additionally, there have marked red and green shades to represent resistance and support zones, respectively.
Support: The green line and green shade represent support levels. These levels are where the price tends to find buying interest, preventing it from falling further. Traders can consider these levels as potential buying opportunities.
Resistance: The red line and red shade represent resistance levels. These levels are where the price tends to encounter selling pressure, preventing it from rising further. Traders can consider these levels as potential selling opportunities.
Breakouts: If the price breaks above the resistance zone (red shade) convincingly, it may indicate a bullish breakout, and the price could move higher to the next resistance level. On the other hand, if the price breaks below the support zone (green shade) convincingly, it may indicate a bearish breakout, and the price could move lower to the next support level.
Keltner Channel:
The Keltner Channel is a technical indicator that uses an exponential moving average (EMA) to create an upper and lower channel around the price action. Traders can use this channel to identify potential long and short positions.
Long Position: If the price is above the upper line of the Keltner Channel, it may indicate a potential long opportunity, as it suggests the price is trading above the average range and might continue in an upward trend.
Short Position: If the price is below the lower line of the Keltner Channel, it may indicate a potential short opportunity, as it suggests the price is trading below the average range and might continue in a downward trend.
Disclosure: I am not SEBI registered. I just wanted to let you know that the information provided here is for learning purposes only. Please consult your financial advisor before making any decisions. Tweets neither advice nor endorsement.
Fin Nifty levels (for 09-02-2024)Fin Nifty levels (for 09-02-2024) are given for educational purposes only

Fin Nifty levels (for 08-02-2024) Fin Nifty levels (for 08-02-2024) are given for educational purposes only

FIN NIFTY S/R for 8/2/24Support and Resistance Levels:
Based on the price action, you have to identify two significant levels: the red line acting as resistance and the green line acting as support. Additionally, there have marked red and green shades to represent resistance and support zones, respectively.
Support: The green line and green shade represent support levels. These levels are where the price tends to find buying interest, preventing it from falling further. Traders can consider these levels as potential buying opportunities.
Resistance: The red line and red shade represent resistance levels. These levels are where the price tends to encounter selling pressure, preventing it from rising further. Traders can consider these levels as potential selling opportunities.
Breakouts: If the price breaks above the resistance zone (red shade) convincingly, it may indicate a bullish breakout, and the price could move higher to the next resistance level. On the other hand, if the price breaks below the support zone (green shade) convincingly, it may indicate a bearish breakout, and the price could move lower to the next support level.
Keltner Channel:
The Keltner Channel is a technical indicator that uses an exponential moving average (EMA) to create an upper and lower channel around the price action. Traders can use this channel to identify potential long and short positions.
Long Position: If the price is above the upper line of the Keltner Channel, it may indicate a potential long opportunity, as it suggests the price is trading above the average range and might continue in an upward trend.
Short Position: If the price is below the lower line of the Keltner Channel, it may indicate a potential short opportunity, as it suggests the price is trading below the average range and might continue in a downward trend.
Disclosure: I am not SEBI registered. I just wanted to let you know that the information provided here is for learning purposes only. Please consult your financial advisor before making any decisions. Tweets neither advice nor endorsement.
