Fin Nifty Levels (for 11-10-2023)Fin Nifty Levels (for 11-10-2023) are given for educational purposes only
CNXFINANCE trade ideas

NIFFIN...Broke out..NIFFIN Broke out of a 1.Expanding triange...2..Trendline...3.Inverted head and shoulders..So buy...Please see the charts for the breakout..Even if you dont know patterns ..Never mind..Use common sense..its broken out of the resistance and Moving Fast.

NIFFIN..Buy Zero hero19800 call buy@ 30..this is a all or nothing trade...Reason to buy..cause it gave a good fast momentum green candle up...hoping this will lead to short covering

NIFFIN...Do or Die trade..BUYBuy a call.. 19600@ 50...This is entirely on the premise that mkts will bounce tomorrow..Its a gamble risk of 2000 Rs max...Only for risky traders

Fin Nifty S/R for 10/10/23Support and Resistance Levels:
Based on the price action, you have to identify two significant levels: the red line acting as resistance and the green line acting as support. Additionally, there have marked red and green shades to represent resistance and support zones, respectively.
Support: The green line and green shade represent support levels. These levels are where the price tends to find buying interest, preventing it from falling further. Traders can consider these levels as potential buying opportunities.
Resistance: The red line and red shade represent resistance levels. These levels are where the price tends to encounter selling pressure, preventing it from rising further. Traders can consider these levels as potential selling opportunities.
Breakouts: If the price breaks above the resistance zone (red shade) convincingly, it may indicate a bullish breakout, and the price could move higher to the next resistance level. On the other hand, if the price breaks below the support zone (green shade) convincingly, it may indicate a bearish breakout, and the price could move lower to the next support level.
Keltner Channel:
The Keltner Channel is a technical indicator that uses an exponential moving average (EMA) to create an upper and lower channel around the price action. Traders can use this channel to identify potential long and short positions.
Long Position: If the price is above the upper line of the Keltner Channel, it may indicate a potential long opportunity, as it suggests the price is trading above the average range and might continue in an upward trend.
Short Position: If the price is below the lower line of the Keltner Channel, it may indicate a potential short opportunity, as it suggests the price is trading below the average range and might continue in a downward trend.

Fin-Nifty Expiry WZL for 10-Oct-2023 NSE:CNXFINANCE Expiry WZL for 10-Oct-2023
Wizard Levels/Zones
>Hey buddy, Wait for the price to close above or below-mentioned zones. Once the price closes above or below, SUPPORT becomes RESISTANCE and RESISTANCE becomes SUPPORT.
> If you're following these zones then kindly follow the rules too. Risk management, and Position sizing.
> This is my perception of the market so, kindly do your analysis to get more clarity on the market.
> These levels might help you guys. As per my view, I'm sharing it with you guys.
> This is not a blueprint to happen, so kindly do your own analysis and my view. Thank you for being so supportive.

Fin Nifty Levels (for 10-10-2023)Fin Nifty Levels (for 10-10-2023) are given for educational purposes only


Fin Nifty S/R for 9/10/23Support and Resistance Levels:
Based on the price action, you have to identify two significant levels: the red line acting as resistance and the green line acting as support. Additionally, there have marked red and green shades to represent resistance and support zones, respectively.
Support: The green line and green shade represent support levels. These levels are where the price tends to find buying interest, preventing it from falling further. Traders can consider these levels as potential buying opportunities.
Resistance: The red line and red shade represent resistance levels. These levels are where the price tends to encounter selling pressure, preventing it from rising further. Traders can consider these levels as potential selling opportunities.
Breakouts: If the price breaks above the resistance zone (red shade) convincingly, it may indicate a bullish breakout, and the price could move higher to the next resistance level. On the other hand, if the price breaks below the support zone (green shade) convincingly, it may indicate a bearish breakout, and the price could move lower to the next support level.
Keltner Channel:
The Keltner Channel is a technical indicator that uses an exponential moving average (EMA) to create an upper and lower channel around the price action. Traders can use this channel to identify potential long and short positions.
Long Position: If the price is above the upper line of the Keltner Channel, it may indicate a potential long opportunity, as it suggests the price is trading above the average range and might continue in an upward trend.
Short Position: If the price is below the lower line of the Keltner Channel, it may indicate a potential short opportunity, as it suggests the price is trading below the average range and might continue in a downward trend.

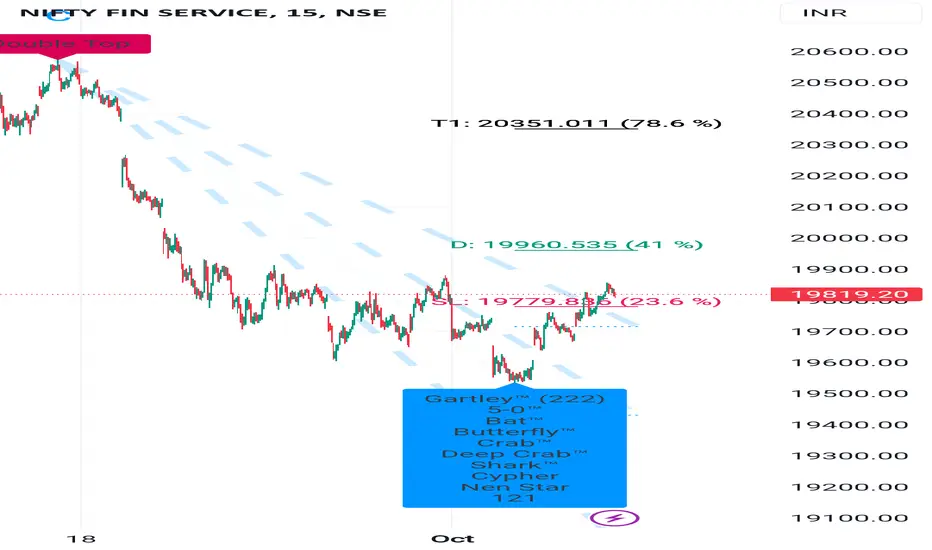
Finnifty ready for 20350 in few days On Our Harmonic pattern indicator based trade setup take trade as explained below :-
Early trades Buy or sell below/ above 23.6 %, safe trades buy or sell above / below 41% , after taking trade next upside or downside levels will be target ,
When reverse buy or sell signal appear then book profit on Target or trail SL to 23.6 % If trailing SL hit then early trade can be taken above or below 23.6 and safe trade can b taken above/ below 41% ..
Please note:-
It's working on news based and volitile market very well so exit if SL hit
Fin Nifty levels (for 09-10-2023) Fin Nifty levels (for 09-10-2023) are given only for educational purposes.

Fin Nifty S/R for 6/10/23Support and Resistance Levels:
Based on the price action, you have to identify two significant levels: the red line acting as resistance and the green line acting as support. Additionally, there have marked red and green shades to represent resistance and support zones, respectively.
Support: The green line and green shade represent support levels. These levels are where the price tends to find buying interest, preventing it from falling further. Traders can consider these levels as potential buying opportunities.
Resistance: The red line and red shade represent resistance levels. These levels are where the price tends to encounter selling pressure, preventing it from rising further. Traders can consider these levels as potential selling opportunities.
Breakouts: If the price breaks above the resistance zone (red shade) convincingly, it may indicate a bullish breakout, and the price could move higher to the next resistance level. On the other hand, if the price breaks below the support zone (green shade) convincingly, it may indicate a bearish breakout, and the price could move lower to the next support level.
Keltner Channel:
The Keltner Channel is a technical indicator that uses an exponential moving average (EMA) to create an upper and lower channel around the price action. Traders can use this channel to identify potential long and short positions.
Long Position: If the price is above the upper line of the Keltner Channel, it may indicate a potential long opportunity, as it suggests the price is trading above the average range and might continue in an upward trend.
Short Position: If the price is below the lower line of the Keltner Channel, it may indicate a potential short opportunity, as it suggests the price is trading below the average range and might continue in a downward trend.

Fin Nifty S/R for 5/10/23Support and Resistance Levels:
Based on the price action, you have to identify two significant levels: the red line acting as resistance and the green line acting as support. Additionally, there have marked red and green shades to represent resistance and support zones, respectively.
Support: The green line and green shade represent support levels. These levels are where the price tends to find buying interest, preventing it from falling further. Traders can consider these levels as potential buying opportunities.
Resistance: The red line and red shade represent resistance levels. These levels are where the price tends to encounter selling pressure, preventing it from rising further. Traders can consider these levels as potential selling opportunities.
Breakouts: If the price breaks above the resistance zone (red shade) convincingly, it may indicate a bullish breakout, and the price could move higher to the next resistance level. On the other hand, if the price breaks below the support zone (green shade) convincingly, it may indicate a bearish breakout, and the price could move lower to the next support level.
Keltner Channel:
The Keltner Channel is a technical indicator that uses an exponential moving average (EMA) to create an upper and lower channel around the price action. Traders can use this channel to identify potential long and short positions.
Long Position: If the price is above the upper line of the Keltner Channel, it may indicate a potential long opportunity, as it suggests the price is trading above the average range and might continue in an upward trend.
Short Position: If the price is below the lower line of the Keltner Channel, it may indicate a potential short opportunity, as it suggests the price is trading below the average range and might continue in a downward trend.

Fin Nifty levels (for 05-10-2023)Fin Nifty levels (for 05-10-2023) are given only for educational purposes.

Fin Nifty levels (for 04-10-2023) Fin Nifty levels (for 04-10-2023) are given only for educational purposes.

Fin Nifty S/R for 4/10/23Support and Resistance Levels:
Based on the price action, you have to identify two significant levels: the red line acting as resistance and the green line acting as support. Additionally, there have marked red and green shades to represent resistance and support zones, respectively.
Support: The green line and green shade represent support levels. These levels are where the price tends to find buying interest, preventing it from falling further. Traders can consider these levels as potential buying opportunities.
Resistance: The red line and red shade represent resistance levels. These levels are where the price tends to encounter selling pressure, preventing it from rising further. Traders can consider these levels as potential selling opportunities.
Breakouts: If the price breaks above the resistance zone (red shade) convincingly, it may indicate a bullish breakout, and the price could move higher to the next resistance level. On the other hand, if the price breaks below the support zone (green shade) convincingly, it may indicate a bearish breakout, and the price could move lower to the next support level.
Keltner Channel:
The Keltner Channel is a technical indicator that uses an exponential moving average (EMA) to create an upper and lower channel around the price action. Traders can use this channel to identify potential long and short positions.
Long Position: If the price is above the upper line of the Keltner Channel, it may indicate a potential long opportunity, as it suggests the price is trading above the average range and might continue in an upward trend.
Short Position: If the price is below the lower line of the Keltner Channel, it may indicate a potential short opportunity, as it suggests the price is trading below the average range and might continue in a downward trend.

Fin Nifty levels (for 03-10-2023) Fin Nifty levels (for 03-10-2023) are given only for educational purposes.

Fin Nifty S/R for 3/10/23Support and Resistance Levels:
Based on the price action, you have to identify two significant levels: the red line acting as resistance and the green line acting as support. Additionally, there have marked red and green shades to represent resistance and support zones, respectively.
Support: The green line and green shade represent support levels. These levels are where the price tends to find buying interest, preventing it from falling further. Traders can consider these levels as potential buying opportunities.
Resistance: The red line and red shade represent resistance levels. These levels are where the price tends to encounter selling pressure, preventing it from rising further. Traders can consider these levels as potential selling opportunities.
Breakouts: If the price breaks above the resistance zone (red shade) convincingly, it may indicate a bullish breakout, and the price could move higher to the next resistance level. On the other hand, if the price breaks below the support zone (green shade) convincingly, it may indicate a bearish breakout, and the price could move lower to the next support level.
Keltner Channel:
The Keltner Channel is a technical indicator that uses an exponential moving average (EMA) to create an upper and lower channel around the price action. Traders can use this channel to identify potential long and short positions.
Long Position: If the price is above the upper line of the Keltner Channel, it may indicate a potential long opportunity, as it suggests the price is trading above the average range and might continue in an upward trend.
Short Position: If the price is below the lower line of the Keltner Channel, it may indicate a potential short opportunity, as it suggests the price is trading below the average range and might continue in a downward trend.

Fin-Nifty WZL for 02-Oct-2023 NSE:CNXFINANCE WZL for 02-Oct-2023
Wizard Levels/Zones
>Hey buddy, Wait for the price to close above or below-mentioned zones. Once the price closes above or below, SUPPORT becomes RESISTANCE and RESISTANCE becomes SUPPORT.
> If you're following these zones then kindly follow the rules too. Risk management, and Position sizing.
> This is my perception of the market so, kindly do your analysis to get more clarity on the market.
> These levels might help you guys. As per my view, I'm sharing it with you guys.
> This is not a blueprint to happen, so kindly do your own analysis and my view. Thank you for your SUPPORT

FINNIFT...Buy..This has given a breakout of a trendline break...This is not based on my average systerm

Fin Nifty levels (for 29-09-2023)Fin Nifty levels (for 29-09-2023) are given only for educational purposes.

Fin Nifty S/R for 29/9/23Support and Resistance Levels:
Based on the price action, you have to identify two significant levels: the red line acting as resistance and the green line acting as support. Additionally, there have marked red and green shades to represent resistance and support zones, respectively.
Support: The green line and green shade represent support levels. These levels are where the price tends to find buying interest, preventing it from falling further. Traders can consider these levels as potential buying opportunities.
Resistance: The red line and red shade represent resistance levels. These levels are where the price tends to encounter selling pressure, preventing it from rising further. Traders can consider these levels as potential selling opportunities.
Breakouts: If the price breaks above the resistance zone (red shade) convincingly, it may indicate a bullish breakout, and the price could move higher to the next resistance level. On the other hand, if the price breaks below the support zone (green shade) convincingly, it may indicate a bearish breakout, and the price could move lower to the next support level.
Keltner Channel:
The Keltner Channel is a technical indicator that uses an exponential moving average (EMA) to create an upper and lower channel around the price action. Traders can use this channel to identify potential long and short positions.
Long Position: If the price is above the upper line of the Keltner Channel, it may indicate a potential long opportunity, as it suggests the price is trading above the average range and might continue in an upward trend.
Short Position: If the price is below the lower line of the Keltner Channel, it may indicate a potential short opportunity, as it suggests the price is trading below the average range and might continue in a downward trend.

FIN NIFTY- Target Levels -THUR-28.09.23Fin Nifty Spot Price : 19722.6 - VIX SPOT Price : 11.58. -
Nifty Daily Range : 19603 To - 19842 - Watch Option Strike : 19700 CE
Watch The Option Target Levels : ----125-----140-----174----209---244----279----314----349----383--+++++++
I Am Not Sebi Registered Analysis, This Is Education Purpose Only.
Dear Followers.. Trend Is Our Friend..
1. Draw The Lines In Your Trading View.. Then Only You Understand My Statistical Startegy.
2. Kindly Watch My Break Even Point. Every Day..
3. Above The Break Even Point.. Resistance Break.. UPTREND Starts.. Buy CE..
4. Below The Break Even Point.. Support Break.. DOWNTREND Starts.. Buy PE..
5. After Retracement.... Stop Loss is Above Or Below Break Even Point..
6. Stop Loss Is Must..
7. Watch 5 Mins Time Frame.. & 15 Mins Time Frame..
8. In Future i Analysis & Focus On Option Strike - Entry, Target, Stop Loss. Also..
Don"t Enter Blindly.
1. We Focus On Our Daily Analysis..
2. Combination Theory Of Delta, Gamma & Thetta,.
3. Selection Of OI Analysis & Prediction Of Entry, Targets, & Stop Loss..
4. We See 4 Types Of Fibinacci Retracement Levels..
(1.High To Low Fib Level, 2.Low To High Fib Level, 3.Long Fib Level & 4. Short Fib Level),
5. Techninal View On Break Even Point..
6. Wait For Support Breaking or Resistance Breaking.. That Time Watch The Market Carefully..
7. Market Moves in UpTrend or DownTrend..
8. Kindly Watch Both The Nifty Target Levels & Bank Nifty Target Levels in your Trading View..
Its Most Important For Daily Tradings..
Kindly Follow My Channel & Like Your Support in My Idea.
BY : newsbharathi27040 / market1tomorrow
