Nifty and banknifty 28 September Monthly ExpiryIndices gave a pull back from the previous video downside levels and is ready for a pull back rally. Gave a hammer on 1 hour & 4 hour chart indicating a bullish outlook for upcoming trading sessions
CNXFINANCE trade ideas

Fin Nifty levels (for 28-09-2023)Fin Nifty levels (for 28-09-2023) are given only for educational purposes.

Fin-Nifty WZL for 27-Sep-2023 NSE:CNXFINANCE WZL for 27-Sep-2023
Wizard Levels/Zones
>Hey buddy, Wait for the price to close above or below-mentioned zones. Once the price closes above or below, SUPPORT becomes RESISTANCE and RESISTANCE becomes SUPPORT.
> If you're following these zones then kindly follow the rules too. Risk management, and Position sizing.
> This is my perception of the market so, kindly do your analysis to get more clarity on the market.
> These levels might help you guys. As per my view, I'm sharing it with you guys.
> This is not a blueprint to happen, so kindly do your own analysis and my view. Thank you for your SUPPORT

Fin Nifty S/R for 27/9/23Support and Resistance Levels:
Based on the price action, you have to identify two significant levels: the red line acting as resistance and the green line acting as support. Additionally, there have marked red and green shades to represent resistance and support zones, respectively.
Support: The green line and green shade represent support levels. These levels are where the price tends to find buying interest, preventing it from falling further. Traders can consider these levels as potential buying opportunities.
Resistance: The red line and red shade represent resistance levels. These levels are where the price tends to encounter selling pressure, preventing it from rising further. Traders can consider these levels as potential selling opportunities.
Breakouts: If the price breaks above the resistance zone (red shade) convincingly, it may indicate a bullish breakout, and the price could move higher to the next resistance level. On the other hand, if the price breaks below the support zone (green shade) convincingly, it may indicate a bearish breakout, and the price could move lower to the next support level.
Keltner Channel:
The Keltner Channel is a technical indicator that uses an exponential moving average (EMA) to create an upper and lower channel around the price action. Traders can use this channel to identify potential long and short positions.
Long Position: If the price is above the upper line of the Keltner Channel, it may indicate a potential long opportunity, as it suggests the price is trading above the average range and might continue in an upward trend.
Short Position: If the price is below the lower line of the Keltner Channel, it may indicate a potential short opportunity, as it suggests the price is trading below the average range and might continue in a downward trend.

Fin Nifty levels (for 27-09-2023)Fin Nifty levels (for 27-09-2023) are given only for educational purposes.

Fin-niftyFin-nifty Chart Analysis......26/09/23
Long : 19770 / Sustain above 19930 lvl.
Sl : 19750
Target : 19910 / 20000 / 20030 / 20050
===================================
Short : Below 19750
Enjoy !

Finnifty monthly expiry After a sharp fall, today Finnifty bounced back with 100+ points.
we can expect monthly expiry will be range bound between 19750 to 19920.either above or below only directional move is possible.

Fin Nifty levels (for 26-09-2023)Fin Nifty levels (for 26-09-2023) are given only for educational purposes.

Fin-Nifty Expiry WZL for 26-Sep-2023 NSE:CNXFINANCE Expiry WZLfor 26-Sep-2023
Wizard Levels/Zones
>Hey buddy, Wait for the price to close above or below-mentioned zones. Once the price closes above or below, SUPPORT becomes RESISTANCE and RESISTANCE becomes SUPPORT.
> If you're following these zones then kindly follow the rules too. Risk management, and Position sizing.
> This is my perception of the market so, kindly do your analysis to get more clarity on the market.
> These levels might help you guys. As per my view, I'm sharing it with you guys.
> This is not a blueprint to happen, so kindly do your own analysis and my view. Thank you for your SUPPORT

Indices for 26 September - Bullish but profit booking expected Today nifty gave a flat closing looking to end bearishness amid pullback and so is for banknifty and finnnifty . Structure is slowly turning to bullish but the view remains cautious bullish.Buy on the dip and sell on rise strategy to play with bullishness

Fin NIfty S/R for 26/9/23Support and Resistance Levels:
Based on the price action, you have to identify two significant levels: the red line acting as resistance and the green line acting as support. Additionally, there have marked red and green shades to represent resistance and support zones, respectively.
Support: The green line and green shade represent support levels. These levels are where the price tends to find buying interest, preventing it from falling further. Traders can consider these levels as potential buying opportunities.
Resistance: The red line and red shade represent resistance levels. These levels are where the price tends to encounter selling pressure, preventing it from rising further. Traders can consider these levels as potential selling opportunities.
Breakouts: If the price breaks above the resistance zone (red shade) convincingly, it may indicate a bullish breakout, and the price could move higher to the next resistance level. On the other hand, if the price breaks below the support zone (green shade) convincingly, it may indicate a bearish breakout, and the price could move lower to the next support level.
Keltner Channel:
The Keltner Channel is a technical indicator that uses an exponential moving average (EMA) to create an upper and lower channel around the price action. Traders can use this channel to identify potential long and short positions.
Long Position: If the price is above the upper line of the Keltner Channel, it may indicate a potential long opportunity, as it suggests the price is trading above the average range and might continue in an upward trend.
Short Position: If the price is below the lower line of the Keltner Channel, it may indicate a potential short opportunity, as it suggests the price is trading below the average range and might continue in a downward trend.

FinniftyFinnifty Chart Analysis.......25/09/23
If Fin-Nifty price goes below 19400 level, next support is seen at 18000 level according to the harmonic pattern.
Question : Now how to trade it?
Whenever there is such a bearish view in the market or there is a trend change then you should sell at every high or sell at every swing low as shown in the profit book with a line. Here I have told you to sell at the top or break the 19424 level and then retest and go below to sell.
Please give the answer in the comment below.
Enjoy !

Fin Nifty Levels (for 25-09-2023)Fin Nifty Levels (for 25-09-2023) are given in the chart for educational purposes only

Fin-Nifty levels for 25-Sep-2023 NSE:CNXFINANCE Levels for 25-Sep-2023
Wizard Levels/Zones
>Hey buddy, Wait for the price to close above or below-mentioned zones. Once the price closes above or below, SUPPORT becomes RESISTANCE and RESISTANCE becomes SUPPORT.
> If you're following these zones then kindly follow the rules too. Risk management, and Position sizing.
> This is my perception of the market so, kindly do your analysis to get more clarity on the market.
> These levels might help you guys. As per my view, I'm sharing it with you guys.
> This is not a blueprint to happen, so kindly do your own analysis and my view. Thank you for your SUPPORT

Fin Nifty S/R for 25/9/23Support and Resistance Levels:
Based on the price action, you have to identify two significant levels: the red line acting as resistance and the green line acting as support. Additionally, there have marked red and green shades to represent resistance and support zones, respectively.
Support: The green line and green shade represent support levels. These levels are where the price tends to find buying interest, preventing it from falling further. Traders can consider these levels as potential buying opportunities.
Resistance: The red line and red shade represent resistance levels. These levels are where the price tends to encounter selling pressure, preventing it from rising further. Traders can consider these levels as potential selling opportunities.
Breakouts: If the price breaks above the resistance zone (red shade) convincingly, it may indicate a bullish breakout, and the price could move higher to the next resistance level. On the other hand, if the price breaks below the support zone (green shade) convincingly, it may indicate a bearish breakout, and the price could move lower to the next support level.
Keltner Channel:
The Keltner Channel is a technical indicator that uses an exponential moving average (EMA) to create an upper and lower channel around the price action. Traders can use this channel to identify potential long and short positions.
Long Position: If the price is above the upper line of the Keltner Channel, it may indicate a potential long opportunity, as it suggests the price is trading above the average range and might continue in an upward trend.
Short Position: If the price is below the lower line of the Keltner Channel, it may indicate a potential short opportunity, as it suggests the price is trading below the average range and might continue in a downward trend.

Fin Nifty S/R for 22/9/23Support and Resistance Levels:
Based on the price action, you have to identify two significant levels: the red line acting as resistance and the green line acting as support. Additionally, there have marked red and green shades to represent resistance and support zones, respectively.
Support: The green line and green shade represent support levels. These levels are where the price tends to find buying interest, preventing it from falling further. Traders can consider these levels as potential buying opportunities.
Resistance: The red line and red shade represent resistance levels. These levels are where the price tends to encounter selling pressure, preventing it from rising further. Traders can consider these levels as potential selling opportunities.
Breakouts: If the price breaks above the resistance zone (red shade) convincingly, it may indicate a bullish breakout, and the price could move higher to the next resistance level. On the other hand, if the price breaks below the support zone (green shade) convincingly, it may indicate a bearish breakout, and the price could move lower to the next support level.
Keltner Channel:
The Keltner Channel is a technical indicator that uses an exponential moving average (EMA) to create an upper and lower channel around the price action. Traders can use this channel to identify potential long and short positions.
Long Position: If the price is above the upper line of the Keltner Channel, it may indicate a potential long opportunity, as it suggests the price is trading above the average range and might continue in an upward trend.
Short Position: If the price is below the lower line of the Keltner Channel, it may indicate a potential short opportunity, as it suggests the price is trading below the average range and might continue in a downward trend.

Fin Nifty Levels (for 22-09-2023)Fin Nifty Levels (for 22-09-2023) are given in the chart for educational purposes only

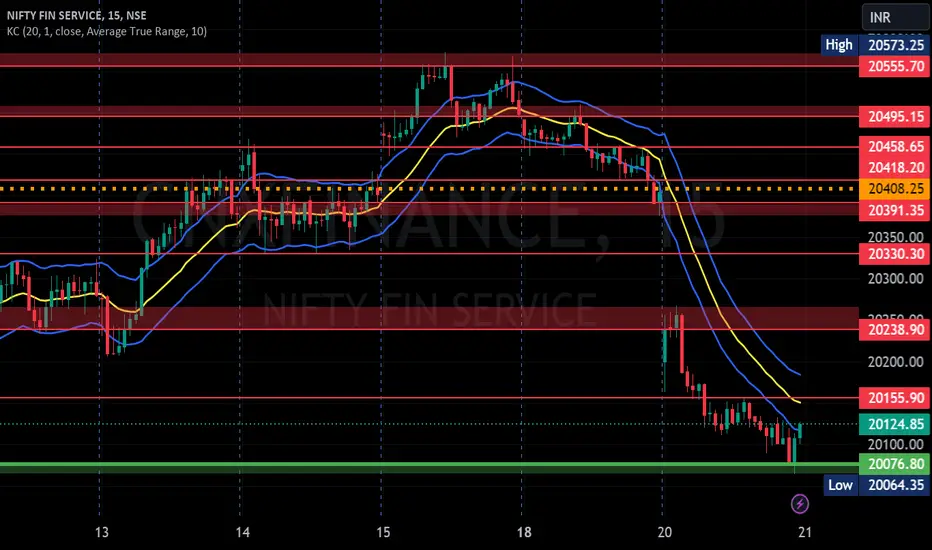
Fin Nifty S/R for 21/9/23Support and Resistance Levels:
Based on the price action, you have to identify two significant levels: the red line acting as resistance and the green line acting as support. Additionally, there have marked red and green shades to represent resistance and support zones, respectively.
Support: The green line and green shade represent support levels. These levels are where the price tends to find buying interest, preventing it from falling further. Traders can consider these levels as potential buying opportunities.
Resistance: The red line and red shade represent resistance levels. These levels are where the price tends to encounter selling pressure, preventing it from rising further. Traders can consider these levels as potential selling opportunities.
Breakouts: If the price breaks above the resistance zone (red shade) convincingly, it may indicate a bullish breakout, and the price could move higher to the next resistance level. On the other hand, if the price breaks below the support zone (green shade) convincingly, it may indicate a bearish breakout, and the price could move lower to the next support level.
Keltner Channel:
The Keltner Channel is a technical indicator that uses an exponential moving average (EMA) to create an upper and lower channel around the price action. Traders can use this channel to identify potential long and short positions.
Long Position: If the price is above the upper line of the Keltner Channel, it may indicate a potential long opportunity, as it suggests the price is trading above the average range and might continue in an upward trend.
Short Position: If the price is below the lower line of the Keltner Channel, it may indicate a potential short opportunity, as it suggests the price is trading below the average range and might continue in a downward trend.
Fin Nifty Levels (for 21-09-2023)Fin Nifty Levels (for 21-09-2023) are given in the chart for educational purposes only

Fin Nifty Levels (for 20-09-2023) Fin Nifty Levels (for 20-09-2023) are given in the chart for educational purposes only.

Fin Nifty S/R for 20/9/23Support and Resistance Levels:
Based on the price action, you have to identify two significant levels: the red line acting as resistance and the green line acting as support. Additionally, there have marked red and green shades to represent resistance and support zones, respectively.
Support: The green line and green shade represent support levels. These levels are where the price tends to find buying interest, preventing it from falling further. Traders can consider these levels as potential buying opportunities.
Resistance: The red line and red shade represent resistance levels. These levels are where the price tends to encounter selling pressure, preventing it from rising further. Traders can consider these levels as potential selling opportunities.
Breakouts: If the price breaks above the resistance zone (red shade) convincingly, it may indicate a bullish breakout, and the price could move higher to the next resistance level. On the other hand, if the price breaks below the support zone (green shade) convincingly, it may indicate a bearish breakout, and the price could move lower to the next support level.
Keltner Channel:
The Keltner Channel is a technical indicator that uses an exponential moving average (EMA) to create an upper and lower channel around the price action. Traders can use this channel to identify potential long and short positions.
Long Position: If the price is above the upper line of the Keltner Channel, it may indicate a potential long opportunity, as it suggests the price is trading above the average range and might continue in an upward trend.
Short Position: If the price is below the lower line of the Keltner Channel, it may indicate a potential short opportunity, as it suggests the price is trading below the average range and might continue in a downward trend.

FIN NIFTY - Target Levels - 18.09.2023.Fin Nifty Spot : 20497.65. Option Strike : 20500 CE & 20500 PE
I Am Not Sebi Registered Analysis, This Is Education Purpose Only.
Dear Followers..
Kindly Watch My Break Even Point. Every Day.
Above The Break Even Point.. Resistance Break.. UPTREND Starts.. Buy CE..
Below The Break Even Point.. Support Break.. DOWNTREND Starts.. Buy PE..
Stop Loss... Above or Below.. Break Even Point..
Don"t Enter Blindly.
We Focus On Our Daily Analysis..
Combination Theory Of Delta, Gamma & Thetta,.
Selection Of OI Analysis & Prediction Of Entry, StopLoss, & Targets,
Fibinacci Retracement Levels, Techninal View On Break Even Point.
Wait For Support or Resistance Breaking.. That Time Watch The Market Carefully.
Market Moves in UpTrend or DownTrend.
Kindly Watch Both The Nifty Target Levels & Bank Nifty Target Levels in your Trading View.
Its Most Important For Daily Tradings….
BY : newsbharathi27040.

Fin Nifty S/R for 19/9/23Support and Resistance Levels:
Based on the price action, you have to identify two significant levels: the red line acting as resistance and the green line acting as support. Additionally, there have marked red and green shades to represent resistance and support zones, respectively.
Support: The green line and green shade represent support levels. These levels are where the price tends to find buying interest, preventing it from falling further. Traders can consider these levels as potential buying opportunities.
Resistance: The red line and red shade represent resistance levels. These levels are where the price tends to encounter selling pressure, preventing it from rising further. Traders can consider these levels as potential selling opportunities.
Breakouts: If the price breaks above the resistance zone (red shade) convincingly, it may indicate a bullish breakout, and the price could move higher to the next resistance level. On the other hand, if the price breaks below the support zone (green shade) convincingly, it may indicate a bearish breakout, and the price could move lower to the next support level.
Keltner Channel:
The Keltner Channel is a technical indicator that uses an exponential moving average (EMA) to create an upper and lower channel around the price action. Traders can use this channel to identify potential long and short positions.
Long Position: If the price is above the upper line of the Keltner Channel, it may indicate a potential long opportunity, as it suggests the price is trading above the average range and might continue in an upward trend.
Short Position: If the price is below the lower line of the Keltner Channel, it may indicate a potential short opportunity, as it suggests the price is trading below the average range and might continue in a downward trend.
