FinNifty Levels for 11-Sep-2023NSE:CNXFINANCE Levels for 11-09-2023
Wizard Levels/Zones
>Hey buddy, Wait for the price to close above or below-mentioned zones. Once the price closes above or below then SUPPORT becomes RESISTANCE and RESISTANCE becomes SUPPORT.
> If you're following these zones then kindly follow the rules too. Risk management, and Position sizing.
> This is my perception of the market so, kindly do your analysis to get more clarity on the market.
> These levels might help you guys. As per my view, I'm sharing it with you guys.
> This is not a blueprint to happen so, kindly do your own analysis along with my view. Thank you for your SUPPORT
CNXFINANCE trade ideas

FinniftyFin nifty for the next expiry and next week.
Candles sustaining will be confirm of trend upside.
(3-4) candles.
Candles rejection will be considered as sell side.
(reverses fast within 1 candle)
Target as mentioned upside red line.
if breaks down i will post other lvls too.

FIN NIFTY 08.09.2023 LEVELSFIN Nifty Spot : 19960.70
Dear Followers Kindly Don't Take Any Buy or Sell Trades Today... Please Watch My Option Level One Week.
Draw Buy, Sl, T1 to T5 Lines In Your Broker Application
Trailing Purpose Only.
Option Buy 19800 CE : Buy At : 155, Sl : 93
T1 : 194, T2 : 233, T3 : 271, T4 : 310, T5 : 349 ........
Option Buy 19800 PE : Buy At : 85, Sl : 51
T1 : 106, T2 : 128, T3 : 149, T4 : 170, T5 : 192 .......
Kindly Watch My Break Even Point. Every Day.
Above The Break Even Point UPTREND Starts
Below The Break Even Point DOWNTREND Starts.
SL Break Even Point Near

Finnifty firing For all trade based on my trade setup -
Risky trades can take trade after crossing 23.6% on either side and safe traders can take trade after 41% We can start buying when our Trailing SL hit at 23.6% with SL of recent low our Target will be 41%, 78.6% , 127.2% 161.8% and 223.6 % , when reversal pattern appears on chart we have to trail our SL if trailing SL hit exit from long trade and initiate sell trade ,

Cup with handleFinnifty forming a cute inverted cup with handle,
Short when everyone is buying💰💰💰
Once handle breaks, expecting a huge down move with out pull back

Fin-Nifty Levels for 08-Sep-2023NSE:BANKNIFTY Levels for 08-09-2023
Wizard Levels/Zones
>Hey buddy, Wait for the price to close above or below-mentioned zones. Once the price closes above or below then SUPPORT becomes RESISTANCE and RESISTANCE becomes SUPPORT.
> If you're following these zones then kindly follow the rules too. Risk management, and Position sizing.
> This is my perception of the market so, kindly do your analysis to get more clarity on the market.
> These levels might help you guys. As per my view, I'm sharing it with you guys.
> This is not a blueprint to happen so, kindly do your own analysis along with my view. Thank you for your SUPPORT

Fin Nifty Levels (for 08-09-2023)Fin Nifty Levels (for 08-09-2023) are given in the chart for educational purposes only.

Fin NIfty S/R for 8/9/23Support and Resistance Levels:
Based on the price action, you have to identify two significant levels: the red line acting as resistance and the green line acting as support. Additionally, there have marked red and green shades to represent resistance and support zones, respectively.
Support: The green line and green shade represent support levels. These levels are where the price tends to find buying interest, preventing it from falling further. Traders can consider these levels as potential buying opportunities.
Resistance: The red line and red shade represent resistance levels. These levels are where the price tends to encounter selling pressure, preventing it from rising further. Traders can consider these levels as potential selling opportunities.
Breakouts: If the price breaks above the resistance zone (red shade) convincingly, it may indicate a bullish breakout, and the price could move higher to the next resistance level. On the other hand, if the price breaks below the support zone (green shade) convincingly, it may indicate a bearish breakout, and the price could move lower to the next support level.
Keltner Channel:
The Keltner Channel is a technical indicator that uses an exponential moving average (EMA) to create an upper and lower channel around the price action. Traders can use this channel to identify potential long and short positions.
Long Position: If the price is above the upper line of the Keltner Channel, it may indicate a potential long opportunity, as it suggests the price is trading above the average range and might continue in an upward trend.
Short Position: If the price is below the lower line of the Keltner Channel, it may indicate a potential short opportunity, as it suggests the price is trading below the average range and might continue in a downward trend.

Fin Nifty S/R levels for 7/9/23Support and Resistance Levels:
Based on the price action, you have to identify two significant levels: the red line acting as resistance and the green line acting as support. Additionally, there have marked red and green shades to represent resistance and support zones, respectively.
Support: The green line and green shade represent support levels. These levels are where the price tends to find buying interest, preventing it from falling further. Traders can consider these levels as potential buying opportunities.
Resistance: The red line and red shade represent resistance levels. These levels are where the price tends to encounter selling pressure, preventing it from rising further. Traders can consider these levels as potential selling opportunities.
Breakouts: If the price breaks above the resistance zone (red shade) convincingly, it may indicate a bullish breakout, and the price could move higher to the next resistance level. On the other hand, if the price breaks below the support zone (green shade) convincingly, it may indicate a bearish breakout, and the price could move lower to the next support level.
Keltner Channel:
The Keltner Channel is a technical indicator that uses an exponential moving average (EMA) to create an upper and lower channel around the price action. Traders can use this channel to identify potential long and short positions.
Long Position: If the price is above the upper line of the Keltner Channel, it may indicate a potential long opportunity, as it suggests the price is trading above the average range and might continue in an upward trend.
Short Position: If the price is below the lower line of the Keltner Channel, it may indicate a potential short opportunity, as it suggests the price is trading below the average range and might continue in a downward trend.

Fin Nifty Levels (for 07-09-2023)Fin Nifty Levels (for 07-09-2023) are given in the chart for educational purposes only.

Fin Nifty Support & Resistance levels for 6/9/23Support and Resistance Levels:
Based on the price action, you have to identify two significant levels: the red line acting as resistance and the green line acting as support. Additionally, there have marked red and green shades to represent resistance and support zones, respectively.
Support: The green line and green shade represent support levels. These levels are where the price tends to find buying interest, preventing it from falling further. Traders can consider these levels as potential buying opportunities.
Resistance: The red line and red shade represent resistance levels. These levels are where the price tends to encounter selling pressure, preventing it from rising further. Traders can consider these levels as potential selling opportunities.
Breakouts: If the price breaks above the resistance zone (red shade) convincingly, it may indicate a bullish breakout, and the price could move higher to the next resistance level. On the other hand, if the price breaks below the support zone (green shade) convincingly, it may indicate a bearish breakout, and the price could move lower to the next support level.
Keltner Channel:
The Keltner Channel is a technical indicator that uses an exponential moving average (EMA) to create an upper and lower channel around the price action. Traders can use this channel to identify potential long and short positions.
Long Position: If the price is above the upper line of the Keltner Channel, it may indicate a potential long opportunity, as it suggests the price is trading above the average range and might continue in an upward trend.
Short Position: If the price is below the lower line of the Keltner Channel, it may indicate a potential short opportunity, as it suggests the price is trading below the average range and might continue in a downward trend.

Fin-niftyFinnifty Chart Analysis.......05/09/23
Long : 19670 Lvl.
Sl : 19625
Target : 19750 / 19775
Enjoy !

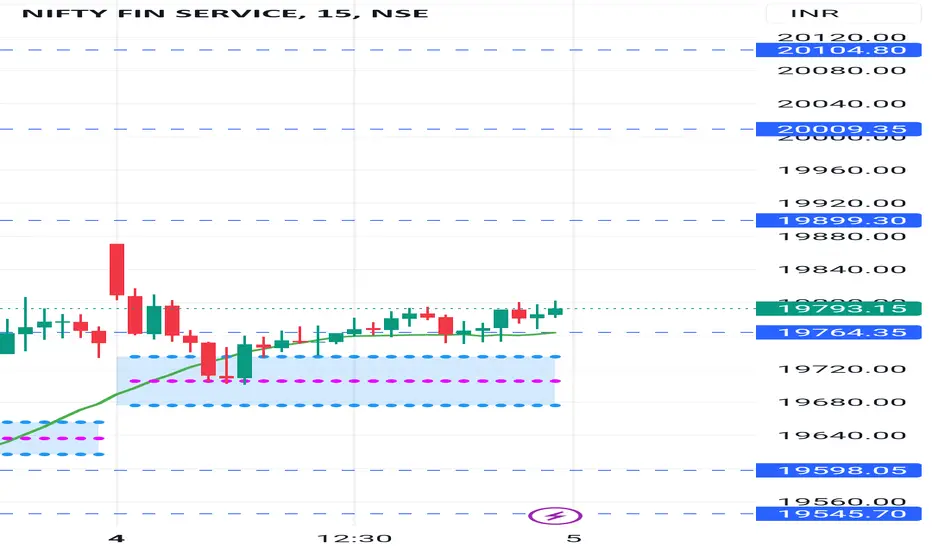
Finnifty Support Zone
19598-19545
Resistance Zone
20009-20104
A long build-up was seen in 83 stocks including Balrampur Chini Mills, National Aluminium Company, Delta Corp, Hindustan Copper and Coforge.
FIN NIFTY 05/09/23Here are the levels for FIN nifty to trade for tomorrow intraday and mark these levels on the chart. Here the price is in the range and if the range is broken then we can expect the direction in the price. Range- 19920 to 19440
TIP: always buy the at low and sell at high.
Here I mention only the high probability trades only. as intraday trader you can have multiple entries and exits according to your setups.
DISCLAIMER: This is my own analysis and you do your own analysis before you take any trade and I am not SEBI registered and contact your financial adviser before taking any trades .I am not responsible for your profit or loss. This is only for educational purpose and learning.
comment below if you have any doubts.

Fin Nifty Levels (for 05-09-2023)Fin Nifty Levels (for 05-09-2023) are given in the chart for educational purposes only.

Fin Nifty Support & Resistance levels for 5/9/23Support and Resistance Levels:
Based on the price action, you have to identify two significant levels: the red line acting as resistance and the green line acting as support. Additionally, there have marked red and green shades to represent resistance and support zones, respectively.
Support: The green line and green shade represent support levels. These levels are where the price tends to find buying interest, preventing it from falling further. Traders can consider these levels as potential buying opportunities.
Resistance: The red line and red shade represent resistance levels. These levels are where the price tends to encounter selling pressure, preventing it from rising further. Traders can consider these levels as potential selling opportunities.
Breakouts: If the price breaks above the resistance zone (red shade) convincingly, it may indicate a bullish breakout, and the price could move higher to the next resistance level. On the other hand, if the price breaks below the support zone (green shade) convincingly, it may indicate a bearish breakout, and the price could move lower to the next support level.
Keltner Channel:
The Keltner Channel is a technical indicator that uses an exponential moving average (EMA) to create an upper and lower channel around the price action. Traders can use this channel to identify potential long and short positions.
Long Position: If the price is above the upper line of the Keltner Channel, it may indicate a potential long opportunity, as it suggests the price is trading above the average range and might continue in an upward trend.
Short Position: If the price is below the lower line of the Keltner Channel, it may indicate a potential short opportunity, as it suggests the price is trading below the average range and might continue in a downward trend.

Finnifty pre market analysis4 SEP ANALYSIS:
Daily analysis:
PS-Position size
FinNifty opens:
side: if it gives breakout (2 step - 30+50)
gapup: buy if it gives breakout after consolidation (60%)
gapdown: will see further price-action

FIN NIFTY 04/09/23Here are the levels for FIN nifty to trade for tomorrow intraday and mark these levels on the chart. ON the daily TF price looks super bullish tomorrow if the price opens gap up or flat then we can expect the price to take a pullback and then it can continue to move up by taking the support. if the price opens with huge gap down then wait for price action then take trades.
TIP: always buy the at low and sell at high.
Here I mention only the high probability trades only. as intraday trader you can have multiple entries and exits according to your setups.
DISCLAIMER: This is my own analysis and you do your own analysis before you take any trade and I am not SEBI registered and contact your financial adviser before taking any trades .I am not responsible for your profit or loss. This is only for educational purpose and learning.
comment below if you have any doubts.

Fin Nifty levels (for 04-09-2023)Fin Nifty levels (for 04-09-2023) are given in the chart for educational purposes only.

Fin Nifty S/R for 4/9/23Support and Resistance Levels:
Based on the price action, you have to identify two significant levels: the red line acting as resistance and the green line acting as support. Additionally, there have marked red and green shades to represent resistance and support zones, respectively.
Support: The green line and green shade represent support levels. These levels are where the price tends to find buying interest, preventing it from falling further. Traders can consider these levels as potential buying opportunities.
Resistance: The red line and red shade represent resistance levels. These levels are where the price tends to encounter selling pressure, preventing it from rising further. Traders can consider these levels as potential selling opportunities.
Breakouts: If the price breaks above the resistance zone (red shade) convincingly, it may indicate a bullish breakout, and the price could move higher to the next resistance level. On the other hand, if the price breaks below the support zone (green shade) convincingly, it may indicate a bearish breakout, and the price could move lower to the next support level.
Keltner Channel:
The Keltner Channel is a technical indicator that uses an exponential moving average (EMA) to create an upper and lower channel around the price action. Traders can use this channel to identify potential long and short positions.
Long Position: If the price is above the upper line of the Keltner Channel, it may indicate a potential long opportunity, as it suggests the price is trading above the average range and might continue in an upward trend.
Short Position: If the price is below the lower line of the Keltner Channel, it may indicate a potential short opportunity, as it suggests the price is trading below the average range and might continue in a downward trend.

Fin Nifty levels (for 01-09-2023) Fin Nifty levels (for 01-09-2023) are given in the chart for educational purposes only.

Fin Nifty Support & Resistance levels for 1/9/23Support and Resistance Levels:
Based on the price action, you have to identify two significant levels: the red line acting as resistance and the green line acting as support. Additionally, there have marked red and green shades to represent resistance and support zones, respectively.
Support: The green line and green shade represent support levels. These levels are where the price tends to find buying interest, preventing it from falling further. Traders can consider these levels as potential buying opportunities.
Resistance: The red line and red shade represent resistance levels. These levels are where the price tends to encounter selling pressure, preventing it from rising further. Traders can consider these levels as potential selling opportunities.
Breakouts: If the price breaks above the resistance zone (red shade) convincingly, it may indicate a bullish breakout, and the price could move higher to the next resistance level. On the other hand, if the price breaks below the support zone (green shade) convincingly, it may indicate a bearish breakout, and the price could move lower to the next support level.
Keltner Channel:
The Keltner Channel is a technical indicator that uses an exponential moving average (EMA) to create an upper and lower channel around the price action. Traders can use this channel to identify potential long and short positions.
Long Position: If the price is above the upper line of the Keltner Channel, it may indicate a potential long opportunity, as it suggests the price is trading above the average range and might continue in an upward trend.
Short Position: If the price is below the lower line of the Keltner Channel, it may indicate a potential short opportunity, as it suggests the price is trading below the average range and might continue in a downward trend.

Fin-Nifty LIVE Levels Wizard Levels/Zones
#Fin-Nifty LIVE Levels 31-08-2023
>Hey buddy, Wait for the price to close above or below-mentioned zones. Once the price closes above or below then SUPPORT becomes RESISTANCE and RESISTANCE becomes SUPPORT.
> If you're following these zones then kindly follow the rules too. Risk management, and Position sizing.
> This is my perception of the market so, kindly do your analysis to get more clarity on the market.
> These levels might help you guys. As per my view, I'm sharing it with you guys.
> This is not a blueprint to happen so, kindly do your own analysis along with my view. Thank you for your SUPPORT.
