Inverted H&S PatternThis is a standard H&S pattern. volume is yet to confirm in my view.
if R1 and R2 zone made a breakout than we expect for bullish run as chart pattern suggests.
Related indices

IT index is still under long term correctionnifty it index is under long term correction with c wave ongoing

Index OverviewIt shows all Index Overview. You can add how many indexes you want and see the overview nicely.

NIFTY IT - The Trump Effect :XThe chart is self-explanatory as always.
Trump's tariffs have sparked serious recession fears in the U.S., negatively impacting both the U.S. economy and its trading partners. Nifty IT is simply following the lead of IG:NASDAQ , which saw a sharp decline of over 5% yesterday.
From a technical sta
NIFTY IT: Is the Bounce Back on the Horizon?📈 NIFTY IT: Is the Bounce Back on the Horizon? 🚀
Current Market Price (CMP): 37,434
Stop Loss (SL): 35,700
Target 1: 38,733
Target 2: 40,527
📊 Market Overview:
After a ~23% correction from its peak, the NIFTY IT index is showing signs of stabilization. The index has formed a small base on the dail

CNXIT, NIFTYThe Chart is bad in shape it can be clearly seen if it break long term trend lines . Those looking to short can Short after weekly closing below the trend lines .
Rest stay way from this index for time being . Long terms target clearly shown .... using two Fibonacci Extensions
This can al

Infosys Vs Nifty IT The markings on the chart are based on the Elliott Wave theory.
The IT index has lagged in strength over the last 1+ year and now seem to enter the next wave C down. While the index made a new high, the internal moves are corrective and divergent on the RSI which makes it a better wave (B) candidat

NIFTY IT - After Effects of NASDAQ?📉The NASDAQ witnessed a sharp decline of approximately 4% yesterday, extending its overall downturn to nearly 13.5% in just three weeks, indicating a strong bearish sentiment.
📉On the other hand, Nifty IT has so far been holding above the 100-week exponential moving average (WEMA), which has been a

#CNXIT #CNXIT
Whenever market becomes expensive, they tend to move away from #gravity line. During 2021/22 top when IT was leading, index was very far away from gravity line and during Q2 & Q3 - there was heavy distribution followed by the jerk in Q4 results with breakaway gap, which made the stocks & in

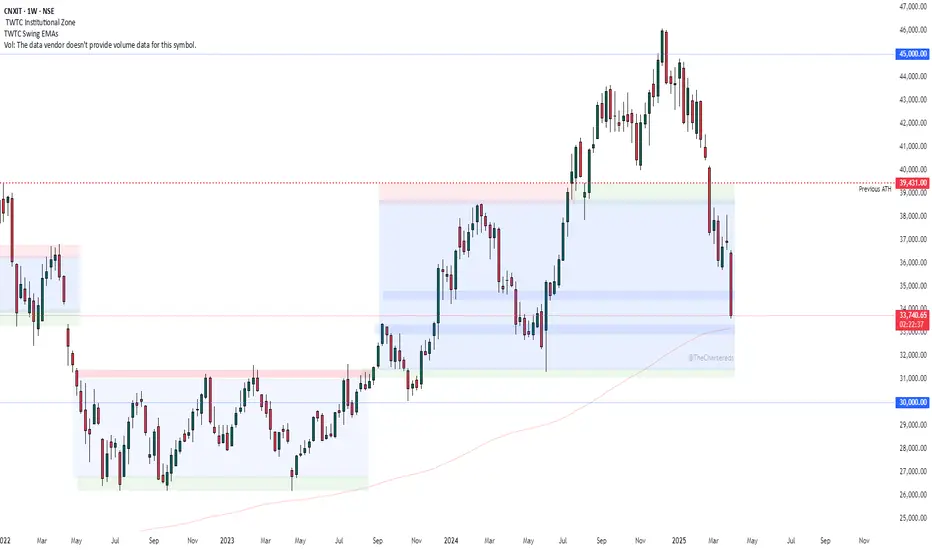
CNXT IT - MAY CORRECT 10-12% CNXIT- I am expecting 10-12% correction in IT Index. We may see retest of BO level 39450 (also there is good DEMAND ZONE) which will be good for long entry in good IT stocks. As of now, I am tracking BSOFT & MPHASIS for long entry at mentioned level.

See all ideas
Displays a symbol's price movements over previous years to identify recurring trends.