CONCOR LONG TECHNICAL TRADENSE:CONCOR A stable company available at 2023 prices despite decent earnings while other companies bleed profits, the valuations are very suitable and we will constantly look for any indication if an early exit might be required, but i Plan to hold the stock until the ATH resistance is reached, Indian markets recently turned bullish on the hourly and continue to remain the same, thus making it a good time to properly "Buy the dip" as opposed to buying when the markets were in free fall
Trump tariff data, US recession risks and other things do loom over a short time frame but the weekly chart shown should indicate that I plan to hold this company for many months if not one or 1.5 years, do let me know your thoughts on the same, or any other company you would like me to analyze or look into next.
CONCOR trade ideas

CONCOR CMP 755, 08.01.2025CONCOR Looking bearish at current level, If break 740 downside, big fall can be seen for targets of 675,610.
Interesting to study,

LONGPositive divergence visible, possible price level given, reserves are surging, borrowings narrowing down. FII holding up. good results expected!

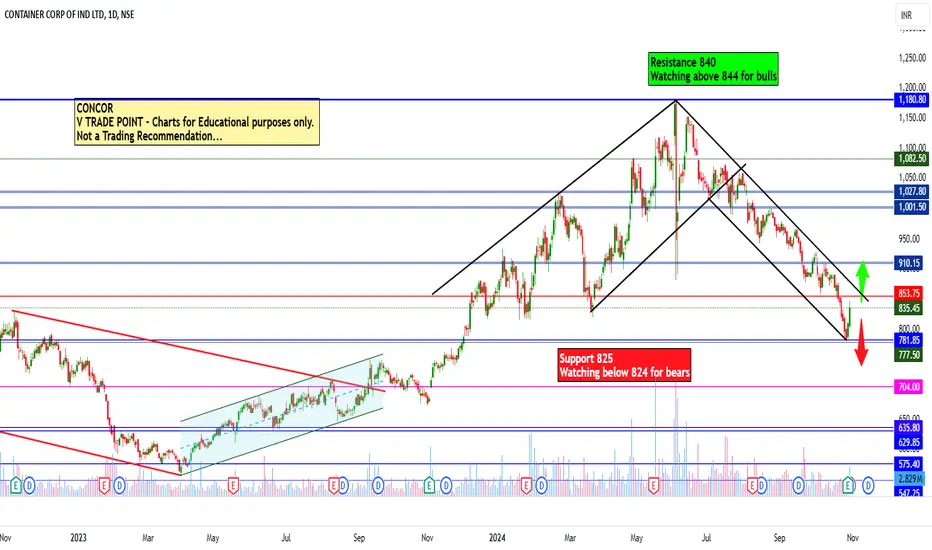
Concor for Intraday 31st October #CONCOR Resistance 840. WatchConcor for Intraday 31st October #CONCOR
Resistance 840. Watching above 844 for upside movement...
Support area 825. Below 832 ignoring upside momentum for intraday
Support 825 .Watching below 824 for downside movement...
Resistance area 840
Above 832 ignoring downside move for intraday
Charts for Educational purposes only.
Please follow strict stop loss and risk reward if you follow the level.
Thanks,
V Trade Point
CONCORHi guys,
In this chart i Found a Demand Zone in CONCOR CHART for Positional entry,
Observed these Levels based on price action and Demand & Supply.
*Don't Take any trades based on this Picture.
... because this chart is for educational purpose only not for Buy or Sell Recommendation..
Thank you


CONCOR S/RSupport and Resistance Levels:
Support Levels: These are price points (green line/shade) where a downward trend may be halted due to a concentration of buying interest. Imagine them as a safety net where buyers step in, preventing further decline.
Resistance Levels: Conversely, resistance levels (red line/shade) are where upward trends might stall due to increased selling interest. They act like a ceiling where sellers come in to push prices down.
Breakouts:
Bullish Breakout: When the price moves above resistance, it often indicates strong buying interest and the potential for a continued uptrend. Traders may view this as a signal to buy or hold.
Bearish Breakout: When the price falls below support, it can signal strong selling interest and the potential for a continued downtrend. Traders might see this as a cue to sell or avoid buying.
20 EMA (Exponential Moving Average):
Above 20 EMA: If the stock price is above the 20 EMA, it suggests a potential uptrend or bullish momentum.
Below 20 EMA: If the stock price is below the 20 EMA, it indicates a potential downtrend or bearish momentum.
Trendline: A trendline is a straight line drawn on a chart to represent the general direction of a data point set.
Uptrend Line: Drawn by connecting the lows in an upward trend. Indicates that the price is moving higher over time. Acts as a support level, where prices tend to bounce upward.
Downtrend Line: Drawn by connecting the highs in a downward trend. Indicates that the price is moving lower over time. It acts as a resistance level, where prices tend to drop.
RSI: RSI readings greater than the 70 level are overbought territory, and RSI readings lower than the 30 level are considered oversold territory.
Combining RSI with Support and Resistance:
Support Level: This is a price level where a stock tends to find buying interest, preventing it from falling further. If RSI is showing an oversold condition (below 30) and the price is near or at a strong support level, it could be a good buy signal.
Resistance Level: This is a price level where a stock tends to find selling interest, preventing it from rising further. If RSI is showing an overbought condition (above 70) and the price is near or at a strong resistance level, it could be a signal to sell or short the asset.
Disclaimer:
I am not a SEBI registered. The information provided here is for learning purposes only and should not be interpreted as financial advice. Consider the broader market context and consult with a qualified financial advisor before making investment decisions.

Concor - a reversal candle on the wayGood fundamentals and already discounted from the peak . Good for investment and short term positions

CONCOR10/06/2024
CONCOR
CMP:1054.95
Wait to retest between 1025-985
Information is only for study purpose

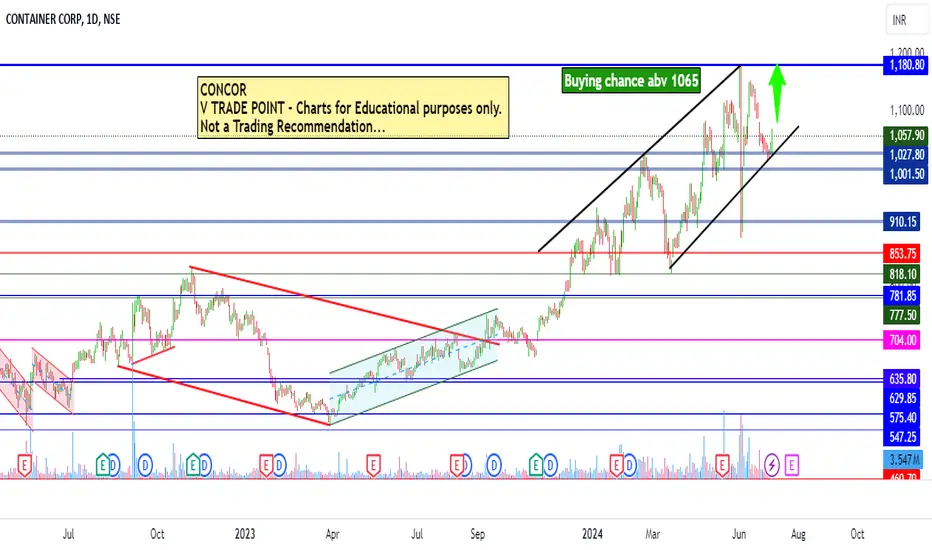
Concor Intraday level for 5th July #CONCOR Concor Intraday level for 8th July #CONCOR
Buying opportunity above 1065
Support area 1053.. Below ignoring buying opportunity
Charts for Educational purposes only.
Please follow strict stop loss and risk reward if you follow the level.
Thanks,
V Trade Point
SWING IDEA - CONCORContainer Corporation stands out as a promising prospect, supported by compelling technical indicators, inviting closer scrutiny.
Reasons are listed below :
Container Corporation has exhibited resilience at the 815 level, undergoing multiple tests before breaking through. The ongoing retest of this level signals a potential paradigm shift in the stock's trajectory.
A bullish marubozu candle on the weekly timeframe serves as a strong bullish signal. Its significance is magnified by its engulfing of the preceding six weekly candles, indicating a decisive shift in market sentiment towards the positive.
The stock's current trading at all-time high levels reflects a robust bullish sentiment. This not only signifies positive market perception but also suggests untapped potential for further upward movement.
Container Corporation's breakout from a period of robust consolidation is a key indicator of unleashed momentum. Such breakouts often mark the initiation of sustained upward trends.
Trading above both the 50 and 200 Exponential Moving Averages (EMA) provides additional technical confirmation, reinforcing the stock's bullish stance and indicating the strength of the prevailing uptrend.
Target - 1030 // 1140
StopLoss - weekly close below 813
DISCLAIMER -
Decisions to buy, sell, hold or trade in securities, commodities and other investments involve risk and are best made based on the advice of qualified financial professionals. Any trading in securities or other investments involves a risk of substantial losses. The practice of "Day Trading" involves particularly high risks and can cause you to lose substantial sums of money. Before undertaking any trading program, you should consult a qualified financial professional. Please consider carefully whether such trading is suitable for you in light of your financial condition and ability to bear financial risks. Under no circumstances shall we be liable for any loss or damage you or anyone else incurs as a result of any trading or investment activity that you or anyone else engages in based on any information or material you receive through TradingView or our services.
@visionary.growth.insights

buyWe can see on daily charts that the stock is in the rising channel pattern and today it re-entered the bottom of the channel post recovery from 4th june lows . Further, the stock took support of 20 EMA and broke the previous resistance of 1083 with decent volumes. good to enter at this price with SL as close below the channel or low of todays candle.

Concor can be bought for target of 1117 in 1-2 days.Concor price above 1175 can be bought for a target of 1117 in 1-2 days. Manage SL as per your risk.

Container Corporation of India Ltd (ticker: CONCOR) ForecastThe chart provided is a 4-hour candlestick chart for Container Corporation of India Ltd (ticker: CONCOR) on the National Stock Exchange (NSE). Here’s a detailed analysis and summary of the chart:
Timeframe and Data:
- Timeframe: 4-hour
- Data Range: From early February 2024 to mid-June 2024
Price Analysis:
- Current Price: ₹1,102.00
- Price Movement: The stock has been in an uptrend since mid-March 2024. The chart shows a series of higher highs and higher lows, indicating an uptrend.
Technical Patterns and Indicators:
- Elliott Wave Analysis:
- The chart appears to be annotated with Elliott Wave counts.
- Wave (1): The first upward wave starting from the mid-March low.
- Wave (2): A corrective wave that retraced some of the gains of Wave (1).
- Wave (3): A strong upward wave that broke the previous high set by Wave (1).
- Wave (4): A corrective wave following Wave (3), not reaching the low of Wave (2).
- Wave (5): The final upward wave, which is currently forming.
- Rising Wedge Pattern:
- The price action appears to be forming a rising wedge pattern, with the upper trendline connecting the highs and the lower trendline connecting the lows.
- Upper Trendline Resistance: Around ₹1,125.00 to ₹1,130.00
- Lower Trendline Support: Around ₹1,065.00 to ₹1,075.00
Key Levels:
- Resistance Levels:
- Immediate resistance at the upper trendline of the rising wedge, approximately around ₹1,125.00 to ₹1,130.00.
- Psychological resistance at ₹1,150.00.
- Support Levels:
- Immediate support at the lower trendline of the rising wedge, around ₹1,065.00 to ₹1,075.00.
- Further support at previous swing lows near ₹1,020.00 and ₹990.00.
Trade Setup:
- Bullish Scenario: If the price breaks above the upper trendline of the rising wedge and sustains above this level, it could indicate further upside potential. The next resistance levels to watch would be ₹1,150.00 and beyond.
- Bearish Scenario: If the price breaks below the lower trendline of the rising wedge, it could signal a potential reversal or deeper correction. The next support levels to watch would be around ₹1,020.00 and ₹990.00.
Conclusion:
The chart for Container Corporation of India Ltd shows the stock in an uptrend, forming an Elliott Wave pattern and a rising wedge. The key levels to watch include the resistance at the upper trendline of the wedge around ₹1,125.00 to ₹1,130.00 and the support at the lower trendline around ₹1,065.00 to ₹1,075.00. A breakout above the upper trendline could suggest further upside, while a breakdown below the lower trendline could indicate a potential reversal or correction. Traders should look for confirmed breakouts in either direction to make informed trading decisions.


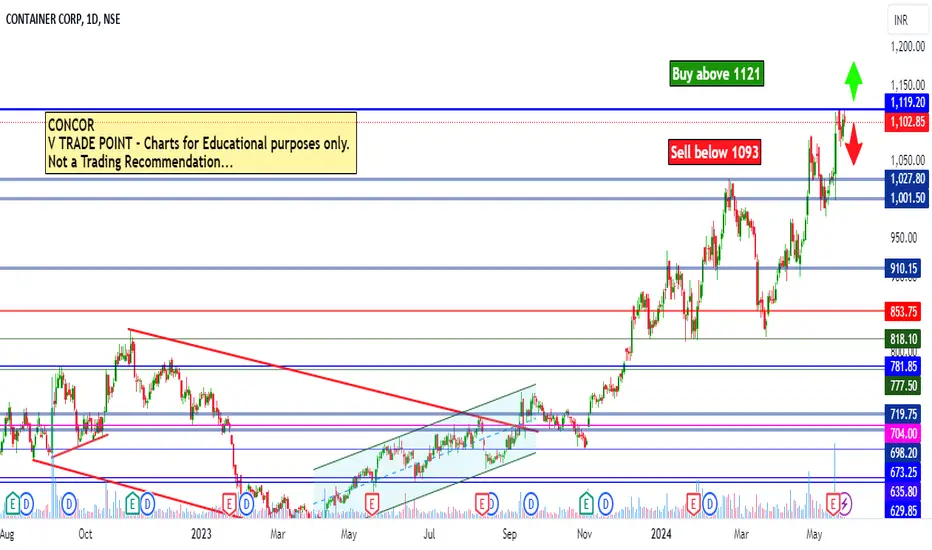
Concor intraday level for today #CONCOR Concor intraday level for today #CONCOR
Buying opportunity above 1121
Selling opportunity below 1093
Charts for educational purposes only.
Please follow strict risk reward and stop loss if you follow the level.
Thanks,
V Trade Point
ConcorConcor is near all-time high levels..Basic price action, can be good for accumulating once it breaks all time level again with good volume

Long - Concor As per price action formation has been made in 1 week TF.
Its a very big move.
Always check the sentiments of the market as per technical analysis, if the pattern get its respect.
Best of luck to all traders.
You are responsible for your Profits and loss, Shared for Educational purpose

breakout @ concorCONCOR, after giving a breakout over its all-time high of 800, has been range bound between 820 and 900. But a good upmove was seen in the stock last week with increasing volumes. On Friday, the stock corrected but closed above this breakout range confirming a successful breakout.
targets mentioned

CONCOR Share -- CE1000 -- BuyConcor -- CE1000 -- HODL-29 FEB
These stocks breakout the upper Trendline and support confirm in weekly time frames
In option you buy CE call you want my Target 1100 in Feb last month
For equity trader you can take swing trade and sale at 1100
Option traders
Take profit 1st - stock price 1000
Take profit 2nd - stock price 1100
For more charts analysis -- comments me in this post.

Concor Concor (container corporation )(short term /swing trade stock )
Gave breakout of inside bar. Looks good for short term /swing trade.
Trading at at 879
Keep sl at 845
Target can be
965 / 1084 / 1284/ 1496 / 1725
Disclaimer :- script disscussed only for education purpose. It is not any recommendation to buy or sell. You will be fully responsible for your profit and losses. If you have any question about my analysis, you can whatsaasp me on 9730763736.

Rising Wedge pattern breakout in CONCORCONTAINER CORPORATION OF INDIA LTD
Key highlights: 💡⚡
✅On 1 Hour Time Frame Stock Showing Breakout of Rising Wedge Pattern.
✅Strong Bullish Candlestick Form on this timeframe.
✅It can give movement up to the Breakout target of 874+.
✅Can Go Long in this stock by placing a stop loss below 838-.

Chart of the week. Concor.After consolidating for 2 year plus Concor has finally given breakout. All the PSU are doing good and this chart is showing a very good accumulation over the long period. Targets are pretty massive and attractive. Moreover, stock will be trading under a blue sky which makes me go for a trade.
CMP - 843 (10/12/23)
T - 950, 1200
SL - 780 w
