CROMPTON trade ideas

CROMPTON CONSUMER ELECTRIC45% Trade for the taking should move quick for now accumalate
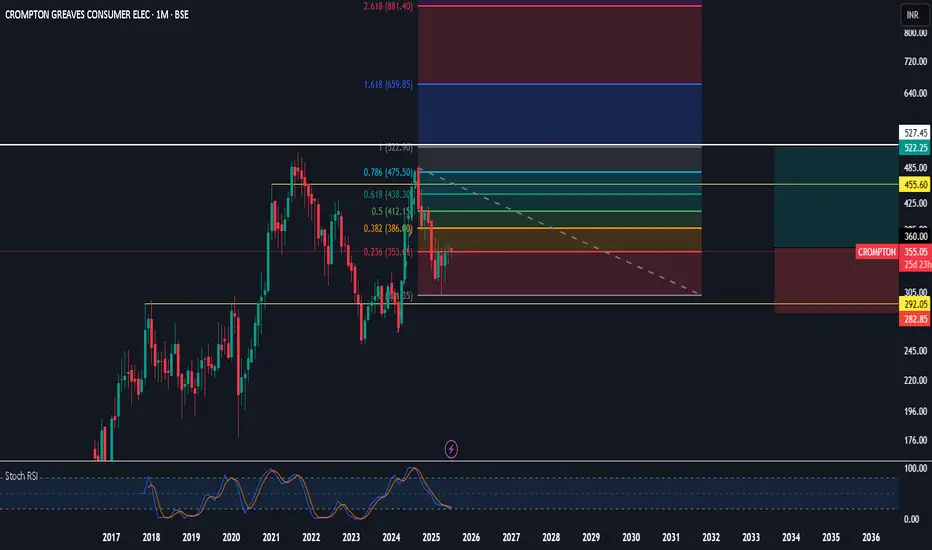
rsi is showing signs of life so going to scale in on monday for a 5-6 month trade could goto 660 or rather deviate to 666 :)
lets see for now identifying some stocks to throw money at for end of Q3
Crompton : Long term Value PickAs per the chart Crompton after a good rally and without crossing previous highs has come to its value area. one can pick here keeping SL below the swing. targets are mentioned above.
Chart for learning purpose Only.

CROMPTON GREAVES ANALYSISGood consolidation between 250 - 320
Can be added on breakout of 320 or retest of 320 level
Any market correction then the stock can be added at 250
Target levels 425 and 520
Disclaimer : It's not a buy/sell recommendation. Posts/views are only for educational purpose.

CROMPTON Daily timeframe analysis for long
NSE:CROMPTON taking bounce back from its 50% golden retrace zone.
Can add more till 380 with SL 360.
Major Targets Highlighted in Blue lines, sub targets in grey lines.

CROMPTON GREACES CONSUMER S/RSupport and Resistance Levels:
Support Levels: These are price points (green line/shade) where a downward trend may be halted due to a concentration of buying interest. Imagine them as a safety net where buyers step in, preventing further decline.
Resistance Levels: Conversely, resistance levels (red line/shade) are where upward trends might stall due to increased selling interest. They act like a ceiling where sellers come in to push prices down.
Breakouts:
Bullish Breakout: When the price moves above resistance, it often indicates strong buying interest and the potential for a continued uptrend. Traders may view this as a signal to buy or hold.
Bearish Breakout: When the price falls below support, it can signal strong selling interest and the potential for a continued downtrend. Traders might see this as a cue to sell or avoid buying.
20 EMA (Exponential Moving Average):
Above 20 EMA(50 EMA): If the stock price is above the 20 EMA, it suggests a potential uptrend or bullish momentum.
Below 20 EMA: If the stock price is below the 20 EMA, it indicates a potential downtrend or bearish momentum.
Trendline: A trendline is a straight line drawn on a chart to represent the general direction of a data point set.
Uptrend Line: Drawn by connecting the lows in an upward trend. Indicates that the price is moving higher over time. Acts as a support level, where prices tend to bounce upward.
Downtrend Line: Drawn by connecting the highs in a downward trend. Indicates that the price is moving lower over time. It acts as a resistance level, where prices tend to drop.
RSI: RSI readings greater than the 70 level are overbought territory, and RSI readings lower than the 30 level are considered oversold territory.
Combining RSI with Support and Resistance:
Support Level: This is a price level where a stock tends to find buying interest, preventing it from falling further. If RSI is showing an oversold condition (below 30) and the price is near or at a strong support level, it could be a good buy signal.
Resistance Level: This is a price level where a stock tends to find selling interest, preventing it from rising further. If RSI is showing an overbought condition (above 70) and the price is near or at a strong resistance level, it could be a signal to sell or short the asset.

Crompton Greeves Consumer Crompton Greeves Consumer - Set ups
MTF Analysis
Crompton Greeves Consumer Yearly Demand Beakout 349
Crompton Greeves Consumer 6 Month Demand Breakout 349
Crompton Greeves Consumer Qtrly Demand BUFL 302
Crompton Greeves Consumer Monthly Demand BUFL 436
Crompton Greeves Consumer Weekly Demand 409
Crompton Greeves Consumer Daily Demand DMIP 405
ENTRY -1 405
SL 393
RISK 12
Taget as per Entry 495
Target return 22%
Points to Gain 90
Latest Last Swing High 483
Latest Last Swing Low 393

crompton : 20 % upbuy above 440
SL 422
we can see move
no technical analysis needed
This is only for educational purpose


Crompton intraday level for 22nd Aug #CROMPTON Crompton intraday level for 22nd Aug #CROMPTON
Buying may witness above 471
Support area 464. Below ignoring buying momentum for intraday
Selling may witness below 464
Resistance area 471
Above ignoring selling momentum for intraday
Charts for Educational purposes only.
Please follow strict stop loss and risk reward if you follow the level.
Thanks,
V Trade Point

50 SMA Rising - Swing TradingI am not a Sebi registered adviser.
This Idea is publish purely for educational purpose only before investing in any stocks please take advise from your financial adviser.
50 SMA Rising strategy. Suitable for Swing Trading Initial Stop loss lowest of last 2 candles and keep trailing with 50 days SMA if price close below 50 SMA then Exit or be in the trade for 2 to 4 weeks.
Do not Forget to Exit is Stop loss Hit.
Be Discipline because discipline is the Success in the STOCK Market.

Buy above 320 TGT 430/650/900 sl below 220The stock is looking to come out of the consolidation after a long time with the volume at breakout point as well as support levels. EMA and other indicators are also indicating the same

Crompton Greaves in BreakoutCrompton Greaves NSE:CROMPTON in breakout and Target would be 529. This can go till 610(which you can take risk using GTT)

Trading with LinesTry to understand how a stock takes support and resistance, there are many lines come to resist the price or support the price. Involve these line in your trading journey.
Regards

Weekly supply zone in confluence with Fibbo 61.8%Confirmation required as we are against a strong push up
Short future hedging with call option.

Chart for Positional tradeDisclaimer: This is for informational purposes only and should not be considered financial advice. Please consult with a financial professional before making any investment decisions.
Additional Considerations:
It's important to do your own research to confirm the trend reversal signal. You can analyze other technical indicators or price patterns to strengthen your conviction.
Manage your risk by adhering to the stop-loss price.
The timeframe is 1-3 months, but be prepared to adjust your position based on market conditions.
Remember, this is just a suggestion based on the limited information provided. It's vital to conduct your own due diligence before entering any trade.

Crompton Greaves - Poised move up?After a long sideways move the stock is now attempting go on upward trajectory. Creasing relative strength and Money flow is supporting the up move. Momentum and Buying Pressure are also increasing. Recent increase in delivery volumes indicate good amount of accumulation. Today's ultra high volume is reason for caution. Once we have a positive close above 343 we can expect a 100 point up move.

CROMPTON - DAILY CHARTThe Structure looks good to us, waiting for this instrument to correct and then give us these opportunities as shown on this instrument (Price Chart).
Note: Its my view only and its for educational purpose only. Only who has got knowledge about this strategy, will understand what to be done on this setup. its purely based on my technical analysis only (strategies). we don't focus on the short term moves, we look for only for Bullish or Bearish Impulsive moves on the setups after a good price action is formed as per the strategy. we never get into corrective moves. because it will test our patience and also it will be a bullish or a bearish trap. and try trade the big moves.
we do not get into bullish or bearish traps. We anticipate and get into only big bullish or bearish moves (Impulsive Moves). Just ride the Bullish or Bearish Impulsive Move. Learn & Know the Complete Market Cycle.
Buy Low and Sell High Concept. Buy at Cheaper Price and Sell at Expensive Price.
Please keep your comments useful & respectful.
Keep it simple, keep it Unique.
Thanks for your support
Tradelikemee Academy
Saanjayy K G

My view on Crompton CROMPTON
Giving double TOP breakdown
Looking tgt 265-262-260++
in very short term
Keeping on radar Crompton 280 PE

Crompton GreavesCROMPTON GREAVES:
Nice Cup and Handle in Weekly Time Frame
30 W SMA is rising.
Do Not Buy at Break Out . (Financial Year Close Nearing)
Entry should be on Retest . If it Misses, its a Miss.

Amazing Reward against the Risk for Crompton Greaves
Price has completed an Upward 5 Wave Sequence structure (Wave 1) and a 3 Wave downward Correction structure (Wave 2), now we have the Wave 3 coming up which is the Wave to surf!!!
We see that Wave 2 has retraced Wave 1 by 61.180% and that is the rule for retracement of Wave 2 as per the Elliott Wave Theory.
Wave 3 as per Fibonacci Extension levels achieves 161.80% of Wave 1.
After reacting to the 6 Months Demand in the left side Price has closed above the EMA confirming Buying Pressure and we also have a Demand formed in Monthly which is our Trade Demand for the Target of Rs. 878.45 that's a Reward of 21.44 against the Risk of Rs. 26.80.
This is the Buy Trade with defined Risk .

Crompton Greaves can give a nice up moveCrompton Greaves might give an update move for INTRADAY or for SWING trade with a small STOPLOSS
Entry - 305 or after sustaining above 305
STOPLOSS - 299
Targets - 312 - 315, 320, 325++
Note: if any trade or value has gone from the place we decided to enter then thats not our trade wait for it to come back or let it go
I am not sebi registered this is my personal view

Crompton greaves can stage a sharp recovery above 321.Rationale
1) Formed a base with a Higher Low, W reversal pattern
2) Trendline break needed to support upmove.
