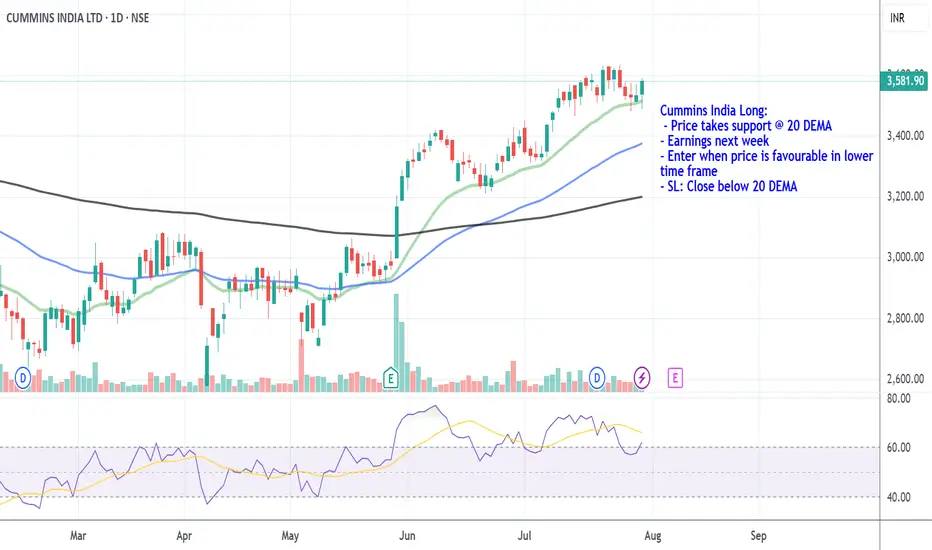
Cummins India Long_Support @ 20 DEMACummins India Long:
- Price takes support @ 20 DEMA
- Earnings next week
- Enter when price is favourable in lower
time frame
- SL: Close below 20 DEMA
CUMMINSIND trade ideas
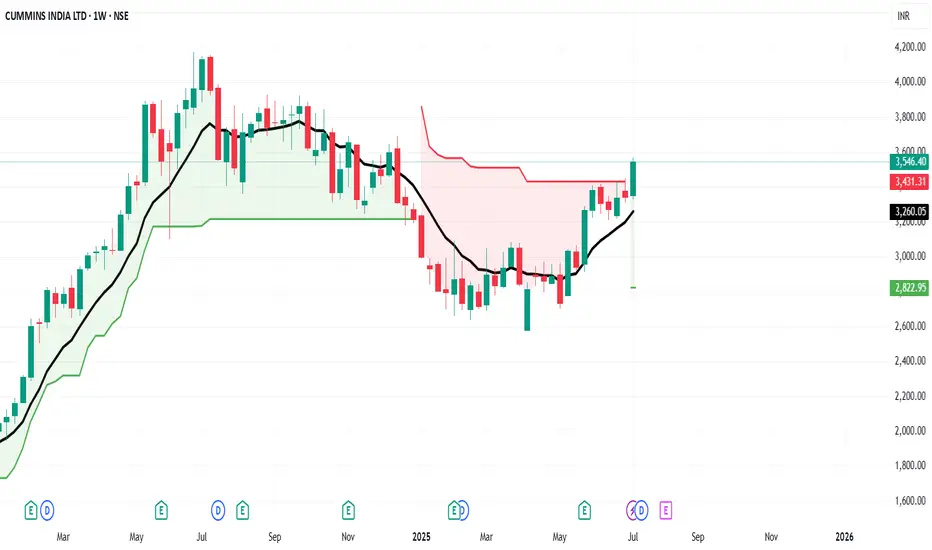
Long CUMMINSINDSuperTrend has turned positive on the weekly chart, with the recent closing price trading above the 10 EMA
BUY CUMMINSIND
Entry - 3570
SL - 3260
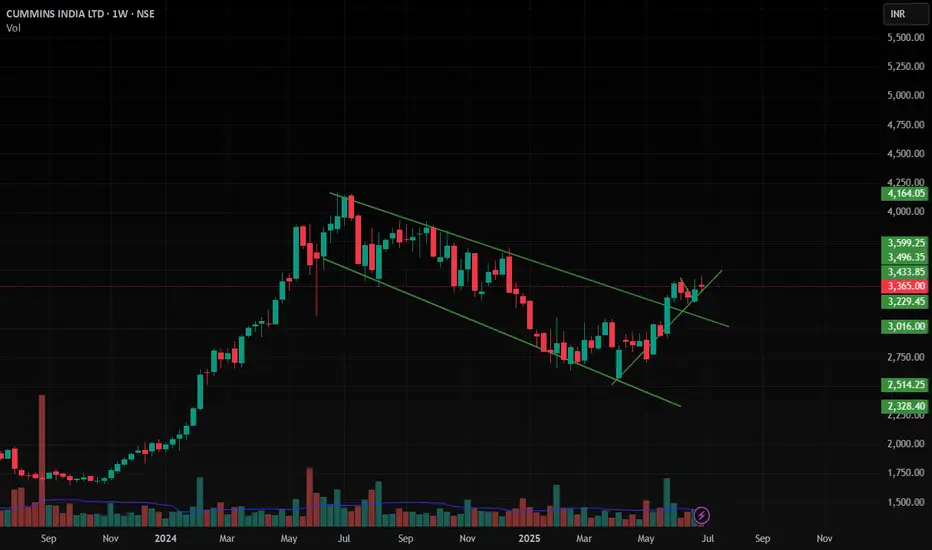
Cumminsind , 1W, Bullishit has Formed a very Good Pattern and Given a Breakout with Good Volume and now it is Trending to Up side ,
Follow proper position sizing and Risk Management
Follow for More Swing Ideas Like this
Rising from the Ashes: CUMMINS INDIA's Grand Wave 5 Launch?After a soul-sucking 11-month correction that chewed through every classic pattern — flats, triangles, zigzags, combos — CUMMINS INDIA may finally be ready for lift-off.
A WXYXZ correction has reached its climax in a clear Wave 4 low near ₹2580, completing the complex structure inside a descending channel.
But the game changed when price:
Broke the 200 SMA
Blasted through the channel
Punched RSI above 70 for the first time since May 2024
And did it with volume breakout
Now, all eyes are on Wave 5 — projected to aim for:
1.0 extension: ₹3569
1.618 extension: ₹3812
Can we reach a new ATH above ₹4171? It’s possible — if this unfolds through nested 1-2-3s, we may be witnessing the start of a larger degree rally.
Invalidation : Below ₹2706. If it breaks, the count may need a rework .
For now? Wait until it retraces to launchpad.?
Disclaimer: This analysis is for educational purposes only and does not constitute investment advice. Please do your own research (DYOR) before making any trading decisions.

Cummins India Ltd – Strong Accumulation Setup | Breakout Trade ⚙️ Cummins India Ltd – Strong Accumulation Setup | Breakout Trade or Buy-on-Dip Opportunity
🔍 Stock Overview & Setup Rationale
Cummins India Ltd, a leader in industrial engines and power solutions, has corrected ~40% from its all-time high and is currently forming a classic breakout setup after smart money-style liquidity grab.
✅ Key Observations:
Price has tapped a major Weekly Point of Interest (POI) — indicating institutional attention.
Liquidity sweep is visible on both daily and weekly charts — stop-losses have been triggered, hinting at accumulation by stronger hands.
13-day consolidation between ₹2,973 and ₹2,800 shows a clear base-building pattern.
This setup gives two types of trade entries depending on market reaction.
🔁 Two Trade Scenarios – Plan Your Entry Like a Pro
🔹 Entry Type 1 – Breakout Entry (Momentum Trade)
▶️ Wait for a 15-min or 1-hr candle close above ₹2,973
🔸 This confirms breakout from the tight range and signals higher high formation
Element Level
Entry Breakout above ₹2,973
Stop-Loss ₹2,800 (range low)
Targets ₹3,094 → ₹3,240 → ₹3,405 → ₹3,690
🔹 Entry Type 2 – Buy on Dip (Safer Risk-Reward Entry)
▶️ If the breakout fails and price pulls back to ₹2,790–₹2,715 zone, this is a strong re-entry opportunity
🔸 Price would be retesting the demand zone after fakeout/liquidity collection
Element Level
Entry ₹2,790–₹2,715 zone
Stop-Loss ₹2,580 (recent swing low)
Targets Same: ₹3,094 → ₹3,240 → ₹3,405 → ₹3,690
📈 Analysis Summary – Step-by-Step
Price corrected ~40% from top and has now tapped into a strong weekly demand zone.
There’s visible liquidity sweep (GRB) on both daily and weekly charts, suggesting smart money is active.
Current sideways consolidation (13 days) between ₹2,973–₹2,800 indicates a base formation.
A breakout above ₹2,973 could trigger new trend highs with multiple swing targets.
If it pulls back to ₹2,790–₹2,715, the zone offers an ideal buy-on-dip opportunity.
In both cases, well-defined stop-loss and risk-reward ratios make it a compelling trade idea.
📢 Don’t Miss Out!
✅ Follow me for more smart money-based, breakout, and swing trade ideas!
👍 Drop a like if you found this analysis helpful and comment your views or charts.
💬 Let’s discuss in the comment section — see you there! 🚀📊
🙏 Thanks for your support. Let’s trade smart and grow together!
Cummins India Limited – Strong Fundamentals Powering the FutureCummins India Limited, a subsidiary of Cummins Inc. (USA), is a dominant player in the Indian power solutions market. It operates across three core segments: Power Systems (generators, alternators), Industrial Engines (used in construction, mining, and marine applications), and Distribution (aftermarket services). The company benefits directly from India's infrastructure growth, export opportunities, and the transition to energy-efficient technologies.
🔍 Fundamental Highlights
For FY24, Cummins India reported revenue of ₹8,173 Cr with an EBITDA of ₹1,689 Cr, translating into an EBITDA margin of 20.7%. Net profit stood at ₹1,248 Cr, giving a net margin of 15.3%. The company reported earnings per share (EPS) of ₹45.6.
It remains financially strong with a return on equity (ROE) of 24.5%, return on capital employed (ROCE) at 30.2%, and a very low debt-to-equity ratio of just 0.01, making it virtually debt-free. The current ratio is 2.4, showing strong liquidity, and the inventory turnover ratio is 7.1, reflecting efficient operations.
Despite premium valuations – the stock trades at a P/E of around 69.9x and a P/B of 16.4x – investors remain bullish due to its brand strength, consistent dividends (yielding about 1.3%), and a cash reserve exceeding ₹3,000 Cr.
📉 Technical View – Breakout Confirmed
On 29th May, Cummins India broke out of a long-standing weekly contraction range. The breakout was backed by a volume spike of 2.86 million shares, which is significantly above the 30-day average volume of 614.92K – a nearly 5x surge, often indicative of institutional accumulation.
Momentum is firmly in play with the RSI at 68 on the daily timeframe, holding above the key 60 level— a bullish momentum zone suggesting further upside potential.
🔍 Key Levels
Reversal Zone: ₹2,850 – ₹2,975
Resistance 1: ₹3,285
Resistance 2: ₹3,642
Resistance 3: ₹4,000
Conclusion:
Cummins India shows strong breakout backed by fundamentals and volume. Watch for momentum above ₹3,285 or dips near ₹2,975 for potential entries.

CUMMINS INDIA SWING TRADE SETUP📊 Price Action & Trend Analysis
Analyzing market trends using price action, key support/resistance levels, and candlestick patterns to identify high-probability trade setups.
Always follow the trend and manage risk wisely!
Price Action Analysis Interprets Market Movements Using Patterns And Trends On Price Charts.
👉👉👉Follow us for Live Market Views/Trades/Analysis/News Updates.

CUMMINS📈 Final Trade Plan – Cummins
Component Value
Trade Direction BUY
Entry Price 2954
Stop Loss (SL) 2858
Risk ₹96
Target Price 4059
Reward ₹1105
Risk-Reward Ratio 11.5 ✅
Last Swing High 3685
Last Swing Low 2580
✅ Why This Trade is High Conviction
Strengths:
✔️ Entry sits just above Daily BUFL and within ITF zone.
✔️ Historical resistance (3685) may act as a profit booking zone, but final target (4059) is structurally aligned to prior breakout levels.
⚠️ Key Considerations
🔄 If 2950–2920 zone breaks down, price might pull toward 2650–2700 MTF zone. Re-enter only with confirmation.
💰 Trail SL once price breaks above 3050, then to 2950 (break-even).
📉 Monitor 3038 as a possible minor resistance – seen in both 60M and 180M zones.
🧭 Tactical Trade Suggestions
🟩 Add-on Entry: Post-breakout above 3038 with strong volume.
🟨 Dip Buying: Reassess for a second entry if price retests 2880 zone with reversal structure.
🔔 Set Alerts: 2920 (watch zone), 3038 (momentum zone), 3685 (partial exit), 4050+ (final exit).
📊 Mazdock – Multi-Timeframe Demand Zone Analysis
🔹 Higher Timeframe (HTF) Zones
Timeframe Trend Demand Logic Type Proximal Distal Avg Zone
Yearly UP Yearly Demand Rally–Rally 2930 1918 2424
Half-Yearly UP 6M Demand BUFL 2930 1918 2424
Quarterly UP Qtrly Demand BUFL 2930 1918 2424
HTF Avg 2930 1918 2424
🔹 Medium Timeframe (MTF) Zones
Timeframe Trend Demand Logic Type Proximal Distal Avg Zone
Monthly UP Monthly Demand BUFL 2930 2100 2515
Weekly UP Weekly Demand SOE 3172 2776 2974
Daily UP Daily Demand DMIP 3230 3038 3134
MTF Avg 3111 2638 2874
🔹 Intraday Timeframe (ITF) Zones
Timeframe Trend Demand Logic Type Proximal Distal Avg Zone
240 Min UP 240M Demand BUFL 2924 2886 2905
180 Min UP 180M Demand BUFL 2932 3038 2985
60 Min UP 60M Demand BUFL 2932 3038 2985
ITF Avg 2929 2987 2958
🧠 Trade Point Summary
Category Proximal Distal Avg Zone
Trade Points 2990 2514 2752

Review and plan for 20th March 2025 Nifty future and banknifty future analysis and intraday plan.
This video is for information/education purpose only. you are 100% responsible for any actions you take by reading/viewing this post.
please consult your financial advisor before taking any action.
----Vinaykumar hiremath, CMT

Review and plan for 10th March 2025Nifty future and banknifty future analysis and intraday plan.
Few stocks analysed.
This video is for information/education purpose only. you are 100% responsible for any actions you take by reading/viewing this post.
please consult your financial advisor before taking any action.
----Vinaykumar hiremath, CMT

Review and plan for 7th March 2025Nifty future and banknifty future analysis and intraday plan.
Few stocks included.
This video is for information/education purpose only. you are 100% responsible for any actions you take by reading/viewing this post.
please consult your financial advisor before taking any action.
----Vinaykumar hiremath, CMT

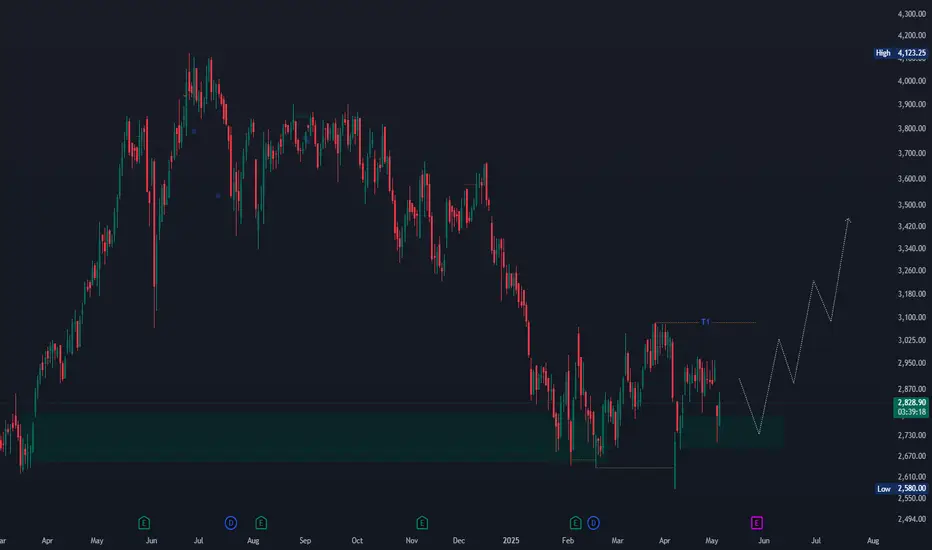
Cummins India LongEntry- 2805-2810. ( Any dip till 2780 will be a buying opportunity)
Support- 2650
Target- 2950, 3000
Pattern- Looking great for a reversal from hereon. Making a bullish engulfing on daily chart and a sort of triple bottom around 2600 levels.
Disclaimer- This is just for education purpose please take advice from your financial advisor before making any decision.
Jai Shree Ram.

CUMMINSIND: Set to Surge for Options Play? 🛡️ Price: Around **2808 INR** (currently) – Consider scaling in if it reaches the **Retracement Zone of 2750-2720 INR.**
🎯 Target: **3138-3150 INR** (Target Zone for Options Trades)
🛑 Stop-Loss: **Hourly close below 2720 INR**
🤔 Why this trade?
✅ Approaching retracement zone – potential strong support.
✅ Potential for a good Risk/Reward.
💡 Pro Tip: The chart shows a clear downtrend followed by a retracement. If the price consolidates within the retracement zone and shows **bullish divergence** on indicators like **RSI** or **MACD**, it could signal a potential reversal. **Watch for a break above the short-term downtrend line** for additional confirmation before entering.
⚠️ Risk/Reward Calculation (Example - You MUST calculate your own based on YOUR entry):
Let's assume entry at **2750 INR** (top of the retracement zone) and the defined stop-loss of **2720 INR**:
🔹 **Potential Gain (using midpoint of target zone):** 3144 - 2750 = **394 INR**
🔹 **Potential Loss:** 2750 - 2720 = **30 INR**
🔹 **Risk/Reward Ratio:** **394 / 30 = Approximately 13.13:1**
📢 Important:
🚨 This is just an idea, **not financial advice.**
⚠ **Trading has risks – you could lose money.**
🧐 **Do your own research before making any trades.**
#Nifty #StockMarket #Trading #TechnicalAnalysis #DayTrading #SwingTrading #Investment #MarketAnalysis #StocksToWatch #BullishSetup #Nifty #BankNifty #GIFTNIFTY

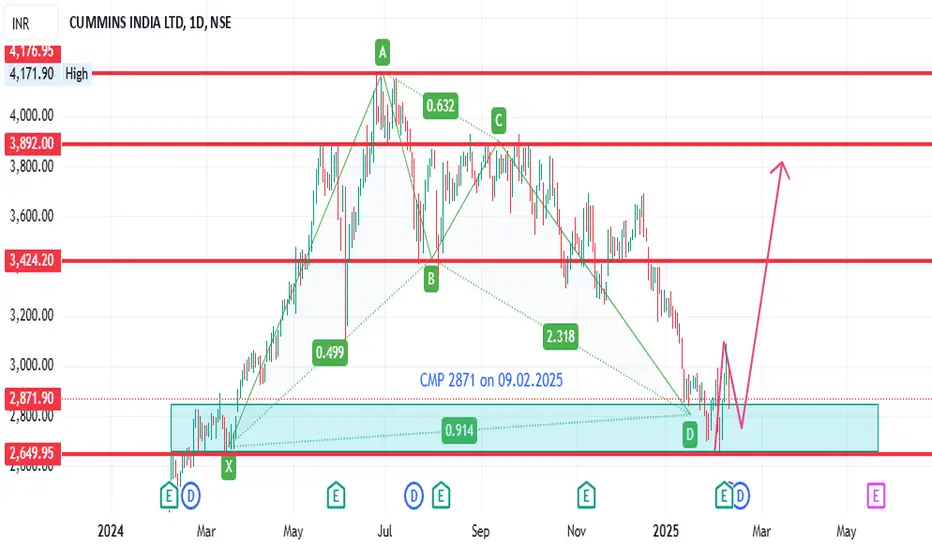
cummins india bulish bat pattern cummins india bulish bat pattern cmp 2871 on 09.02.2025 .. will find the bulish candle at PRZ then will take the entry
Review and plan for 7th February 2025Nifty future and banknifty future analysis and intraday plan.
This video is for information/education purpose only. you are 100% responsible for any actions you take by reading/viewing this post.
please consult your financial advisor before taking any action.
----Vinaykumar hiremath, CMT

Analysis of the Cummins India Ltd. (CUMMINS)Analysis of the Cummins India Ltd. (CUMMINS) Chart:
Key Observations:
Resistance and Breakout Zone:
The chart highlights a significant resistance level at ₹3,600–₹3,620, which the stock is currently testing.
A downtrend line (dotted) also converges near this zone, making it a critical level to watch. A breakout above this trendline would confirm a bullish move.
Support Level:
The ₹3,262 level acts as a strong horizontal support zone. The stock has tested this level multiple times, indicating solid buying interest at this level.
Targets Identified:
Target 1: ₹3,883.75 — This is the next key resistance zone if the stock breaks out above ₹3,620.
Target 2: ₹4,106.45 — This level represents the next significant hurdle based on prior highs.
Consolidation Phase:
The stock has been consolidating in a range between ₹3,262 and ₹3,620 for the past few months, creating a base for a potential breakout.
Targets:
Short-term:
A breakout above ₹3,620 can lead to a move toward ₹3,883 (Target 1).
Sustained momentum beyond ₹3,883 can aim for ₹4,106 (Target 2).
Medium-term:
If ₹4,106 is breached, the stock could head toward ₹4,200–₹4,300 in a strong bullish scenario.
Trading Plan:
Entry:
Enter on a breakout and sustained close above ₹3,620 with volume confirmation.
Stop Loss:
Place a stop loss at ₹3,500 (below the breakout zone) to manage risk.
Target Levels:
Short-term target: ₹3,883.
Medium-term target: ₹4,106.
Pullback Opportunity:
If the stock retraces to ₹3,500–₹3,550 and holds, it could provide a better risk-reward entry point.
Conclusion:
Cummins India Ltd. is at a critical resistance zone. A confirmed breakout above ₹3,620 can signal the start of a bullish move, with immediate targets of ₹3,883 and ₹4,106. Monitor the price action and volume near the resistance for confirmation.

CUMMINSIND : Cummins India- Ready to Fire Up?🚀 🚀
The stock is approaching a critical support zone at ₹3,125 - ₹3,190, aligning perfectly with the Golden Retracement (61.8%), 200-SMA, and an ABC corrective Wave C pattern. 🔥
📊 What to Watch:
1️⃣ Support Zone: ₹3,125 - ₹3,190.
2️⃣ Breakout Target 1: ₹3,336 (trendline resistance).
3️⃣ Target 2: ₹3,648.
4️⃣ Final Target Zone: ₹4,010 - ₹4,108 (if momentum sustains).
📈 Reversal Signs:
Look for bullish patterns like hammer candles or bullish engulfing supported by rising volume at ₹3,125. Volume spike = 🔑 confirmation!
❌ Stop-Loss: ₹3,100 (keep risk in check).
💡 Pro Tip: Liquidity sweep zones often spark big moves—watch closely! This could be a low-risk, high-reward setup! 💥
#Tags:
#CumminsIndia #StockMarket #ElliottWave #TechnicalAnalysis #SwingTrading #PriceAction #StocksToWatch #GoldenRetracement #TradingView #NSE #IndiaMarkets 🚀
Will the bulls take charge? Let me know your thoughts! 👇

Cummins is ready to fall downwww.tradingview.com
• Speed reflects the market's momentum, and Money Flow measures the directional movement of capital within the market
when the Money Flow is bearish, and Speed crosses the threshold, a red triangle appears at the top, indicating a bearish trend.
The indicator setup also highlights unusual volume candles for additional confirmation:
• Blue candles signal unusual bullish volume.
• Pink candles indicate unusual bearish volume.


CUMMINS iNDIA LONGCummins
MTF Analysis
Cummins Yearly Demand Breakout 2045
Cummins 6 Month Demand BUFL 2045
Cummins Qtrly Demand Breakout 3025
Cummins Monthly Demand Breakout 3036
Cummins Weekly BUFL 3466
BOM Daily DMIP 3437
ENTRY 3437
SL 3383
RISK 54
Target 4877
REWARD POINT 1440
Last High 4157
RR 26.67
RR 42%

Cummins LONGCummins India Reaching on Weekly Support
Weekly Support 3500
Daily Support 3470
Potential 4500

Cummins IndiaCUMMINS INDIA
Good time to go for long with small SL.
ENTRY : 3549
SL : 3400
TARGET : 4500
NOTE: We are not SEBI registered. It's for knowledge purpose only. Consult to your financial adviser before take any trade.
