CUMMINSIND trade ideas

CUMMINSNSE:CUMMINSIND
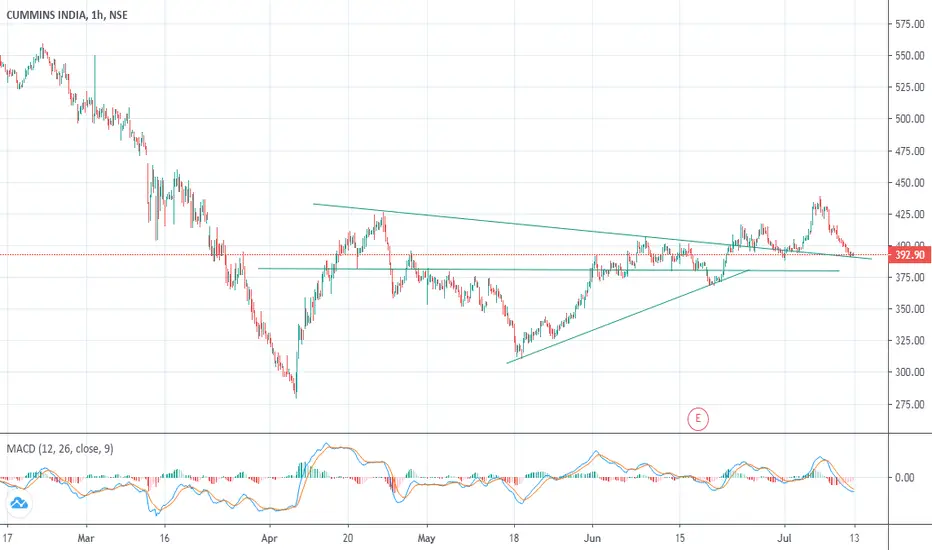
Keep an eye on trendline, you might get the direction.
**********************************************************************************************************************************************
Hi all,
Its pleasure to have you all here.
I have started putting these charts as a contribution from my side to all people who are new to business, as I had to struggle a lot without any sources at disposal. So please consider this a just small contribution from my side.
Few Honest Disclosures:
1. Any idea shared is my personal view, its not a recommendation, neither any kind of paid propaganda, so please
do your bit of research.
2. Ideas shared does not mean that I trade all or have position in them, this is just a helping hand to all.
3. I expect no comments or like nor any negativity, as I said its just a small helping hand from my side, please plan your risk and trade as per your capacity.
4. To trade in Cash, options or futures is your sole choice and your own risk
5. I am no expert in Tech Indicators, I believe in support resistance and trendline theory, you may use this as a supplement theory for better results.
6. I work for my own living, this is a hobby which I do sincerely to help anyone who might come across my charts.
***********************************************************************************************************************************************
CUMMINS_LONGwaiting for 0.7 level retracement..if this level sustains then we can go long till last swing high

Cummins India near to breakout - Level and SupportMany Broker house bullish on Cummins India for Long and suggesting the Target between 448-465. But we have different view on it.
Stock's Relative Strength is decreasing in Benchmark and Sectoral both index and also Stock is treading below 100EMA and 200EMA.
Stock strikes with High increase in Call and Put OI and Aggressive New Long position buildup as well. it's following Fib retracement levels and price is moving under triangle pattern.
Showing BULLISH on below indicator:
CCI in Overbought zone
RSI is Treading UP
Stoch is Treading UP
----------------------------------------------------------
Support : 392 and 380
Breakdown : 398
CMP : 409
Breakout : 413
Short Target : 420 (Very Strong Resistance) and 427
----------------------------------------------------------
Negative Point:
1) Stock's Relative Strength is decreasing in Benchmark and Sectoral both index
2) Stock is treading below 100EMA and 200EMA.
----------------------------------------------------------
(Disclaimer: This is only for educational purpose.)

R-0011 Cross over in a 30 min chart so GO LONG in CUMMINS Short Term Cash Buy CUMMINSIND @410.50-412.50 SL 394.70 TGT 442

CUMMINSTrendline about to be breached, can be a sell with sl of 368 for target of 358, 351 and 346
If it bounces back from trendline, target could be 387 395 and 401 sl 374

Cummins India - Long Target ~470The stock has is stuck in a symmetrical triangle and expected to had a positive breakout - Target ~470


CUMMINSINDIA ::: SHORT13 May 2020
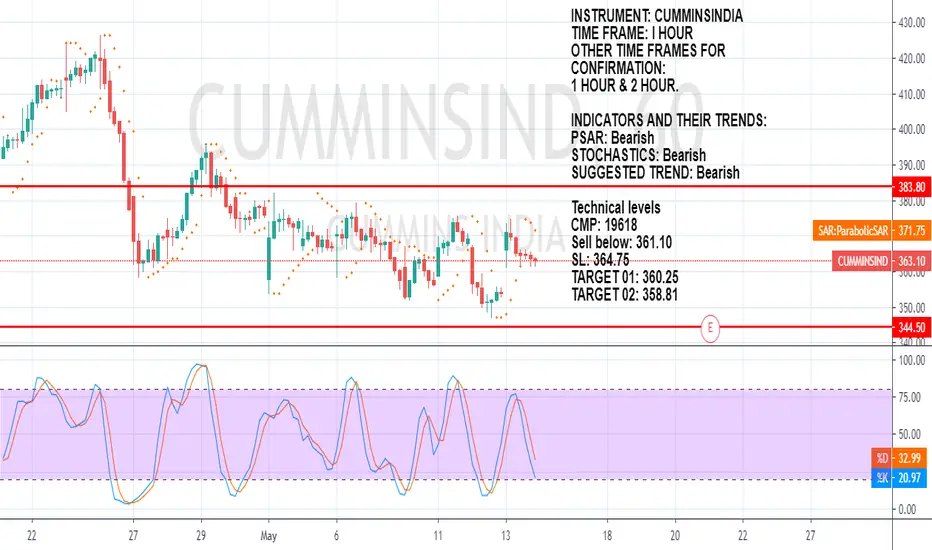
INSTRUMENT: CUMMINSINDIA
TIME FRAME: I HOUR
OTHER TIME FRAMES FOR CONFIRMATION:
1 HOUR & 2 HOUR.
INDICATORS AND THEIR TRENDS:
PSAR: Bearish
STOCHASTICS: Bearish
SUGGESTED TREND: Bearish
Technical levels
CMP: 19618
Sell below: 361.10
SL: 364.75
TARGET 01: 360.25
TARGET 02: 358.81
My analysis of CUMMINSIND is expected to continue its downtrend for some time now. On day time frame Stochastic & PSAR have confirmed the bearish trend. The Bearish trend is confirmed in 1 HOUR & 2 HOUR time frames. If it closes below 358.81 on the end of day time frames we may also see 349.50 to 346.30 levels also
RISK DISCLOSURE:
Technical analysis of FOREX and INDIAN MARKETS. We are not SEBI REGISTERED ANALYSTS the views expressed here are for our record purposes only. Please consult your personal financial advisor before investing. We are in no way responsible for your profits/losses what so ever.
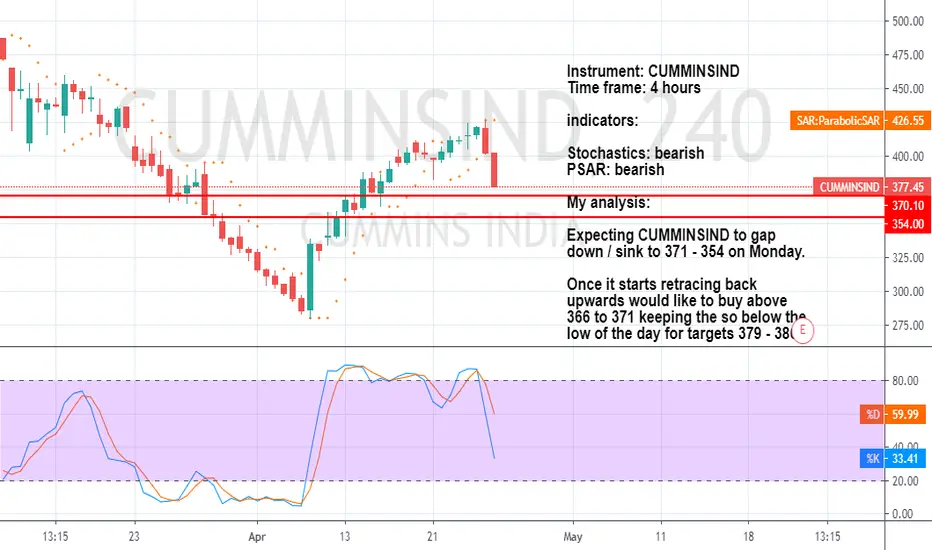
CUMMINSIND GAP DOWN AND BOUNCEInstrument: CUMMINSIND
Time frame: 4 hours
indicators:
Stochastics: bearish
PSAR: bearish
My analysis:
Expecting CUMMINSIND to gap down / sink to 371 - 354 on Monday.
Once it starts retracing back upwards would like to buy above 366 to 371 keeping the so below the low of the day for targets 379 - 386.
RISK DISCLOSURE:
Technical analysis of FOREX and INDIAN MARKETS. We are not SEBI REGISTERED ANALYSTS The views expressed here are for our record purposes only. Please consult your personal financial advisor before investing. We are in no way responsible for your profits/losses what so ever.
Value Investing 9: Cummins IndiaGet value stocks of all sectors - Contact 07066035072 (Whatsapp only)
Sector: Automobile
% Debt of Market capital: <3% (Negligible debt)
PEG: 4.03 (Fast growth)
Beta: 0.94 (Not Volatile)
Fair value: 590 (Compare with current price)
Key buying/support level: 421-345-268
Fundamentals: www.fundata.in

Cummins Industries - Bearish Bias - Go Short at current levels.Cummins Industries - Bearish Bias - Go Short at current levels.

CUMMINSIND Possible LongMACD + RSI Divergence and break of falling wedge , Target can be the resistance blue line

CUMMINS INDIA - LONG ABOVE 607 DT.25.01.2020GMS - SWING TRADE # 4
CUMMINS INDIA - CMP - 595.15
LONG View Above only 607 with SL 570
TARGET - 650 - 700 - 750 (1 - 60 Days)
TARGET - 800 - 840 - 930 (1 - 2 Years)
Shared Chart Learning Purpose Only

Trade idea for cummins indiathere is bullish divergence on daily time frame with falling wedge so expecting a bearish test to that downtrend line placed above it.


Cummins India - BUY - Short TermHi
This is for a short term buy.
It seems Cummins India is a short term buy above 564.80, with a SL of 544 and targets around 600/620.
The Risk Reward ratio is around 1:2 & 1:3.
MACD is showing divergence on daily chart and has given a buy signal.
RSI is nearby 50 and is in with sync with the up-moves as of now.
So with this small SL in mind, we can initiate longs.

